
A world model plans from a state representation, often for tasks it was never trained on. In markets, that state has to carry expected returns, liquidity, volatility, market-wide conditions and cross-asset relationships. Yet financial representation learning has mostly been judged on one forecasting task over one slice of time. We release Market-1T, nearly one trillion one-second observations of U.S. equities from 2008 to 2025, and use it to compare 18 encoder-training strategies across 32 months of market regimes, as the state layer for world models such as DINO-WM,[1] V-JEPA 2[2] and LeWM.[3]
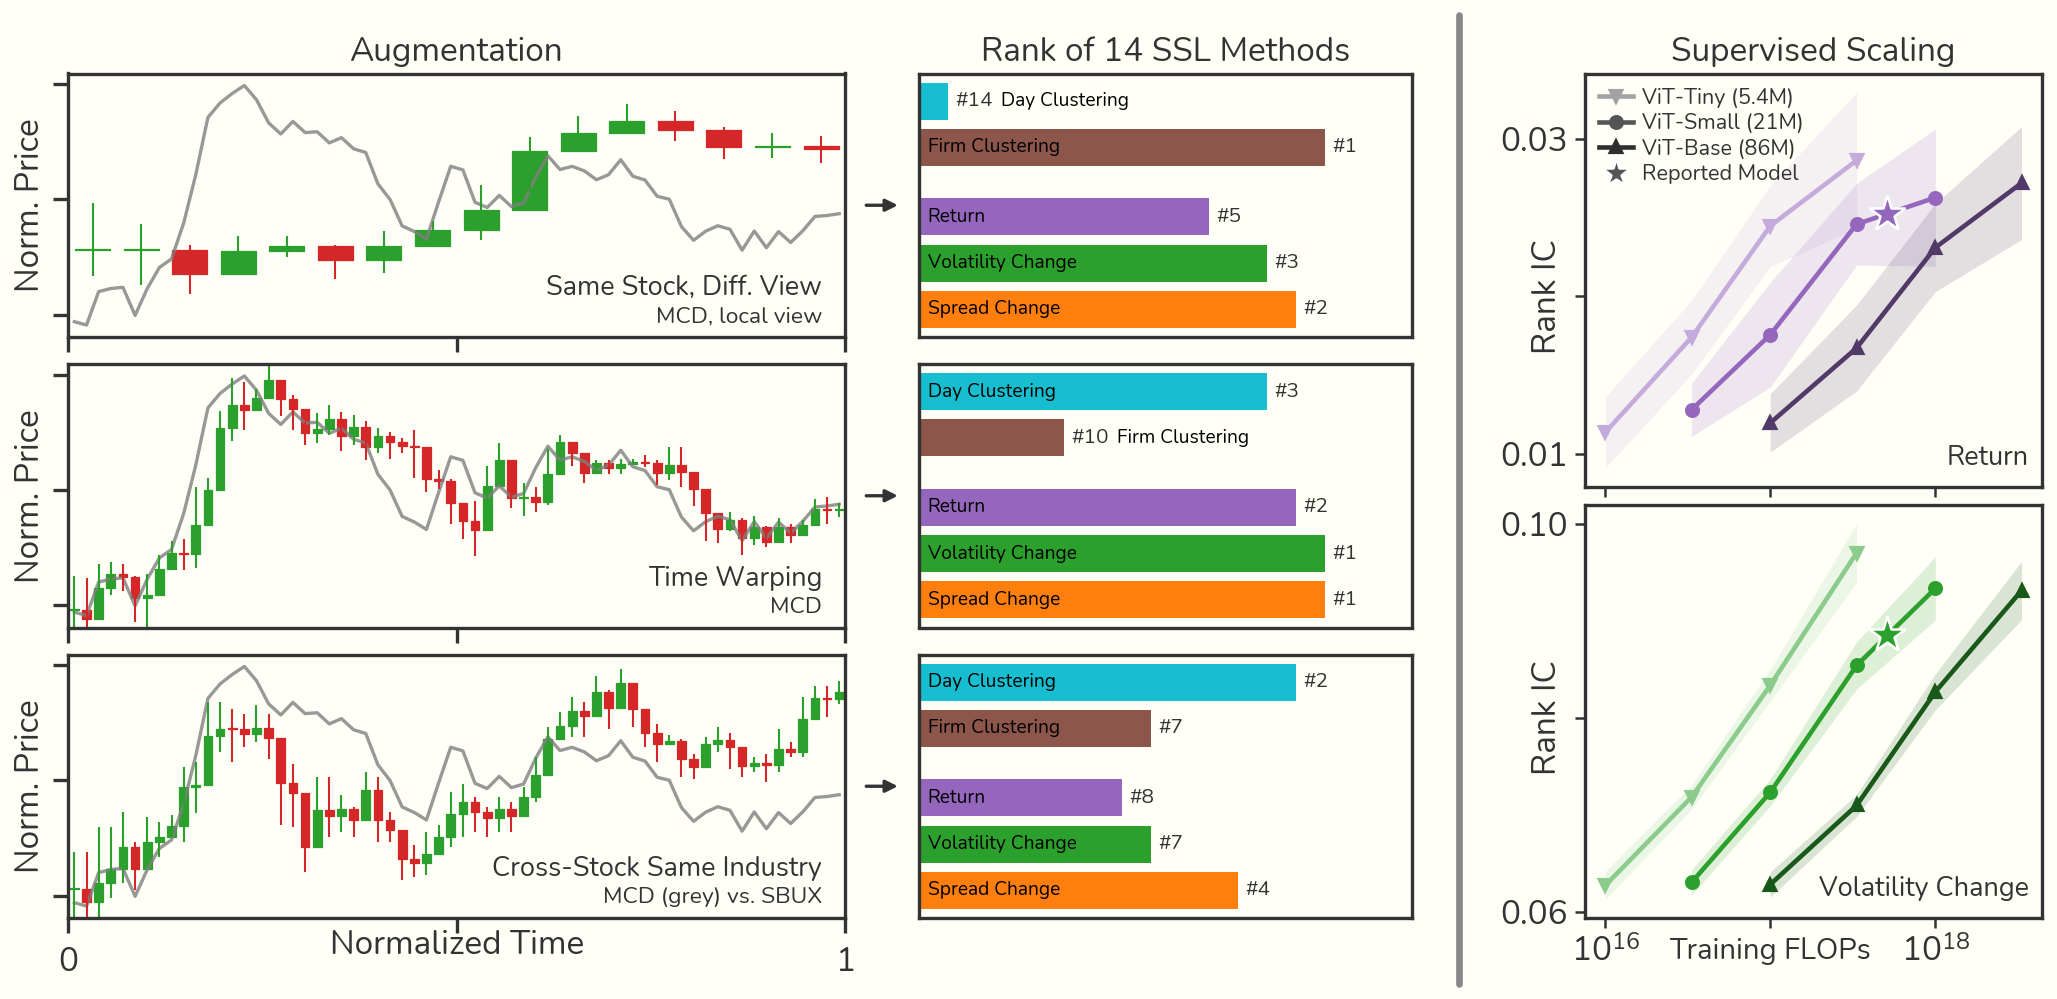
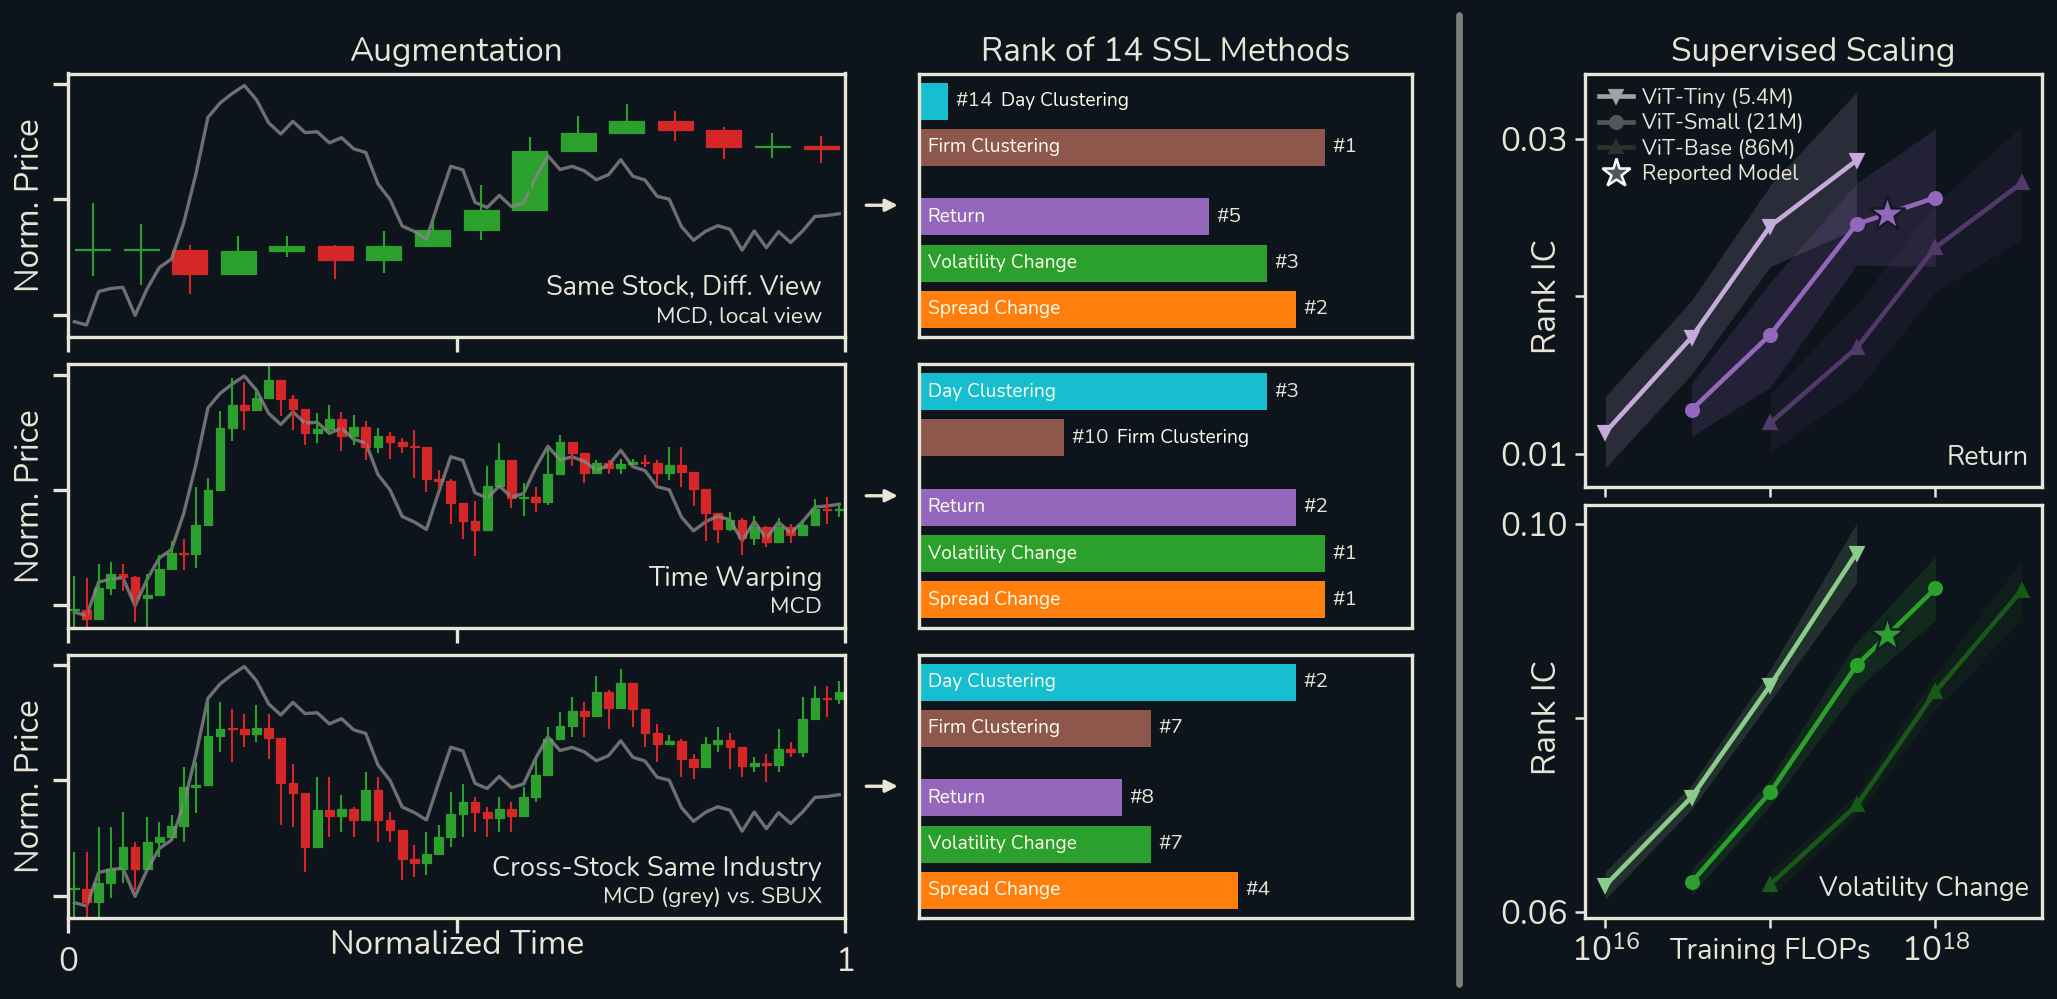
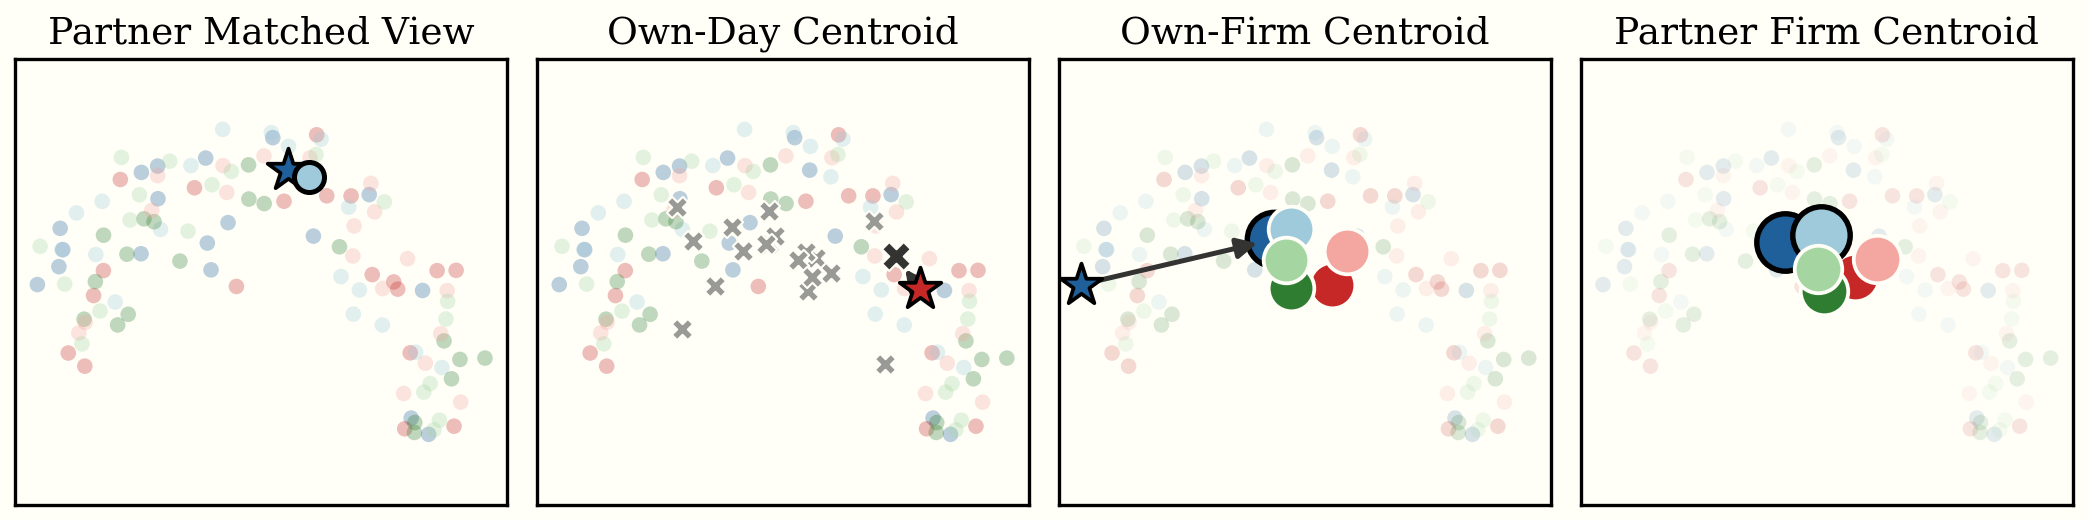
Matching views of the same stock clusters latents by firm and hardly at all by day. At a fixed compute budget, ViT-Tiny beats larger ViTs.
Market-1T
A best-in-class academic dataset spanning 2008–2025 at 1 Hz frequency, released in partnership with Massive.
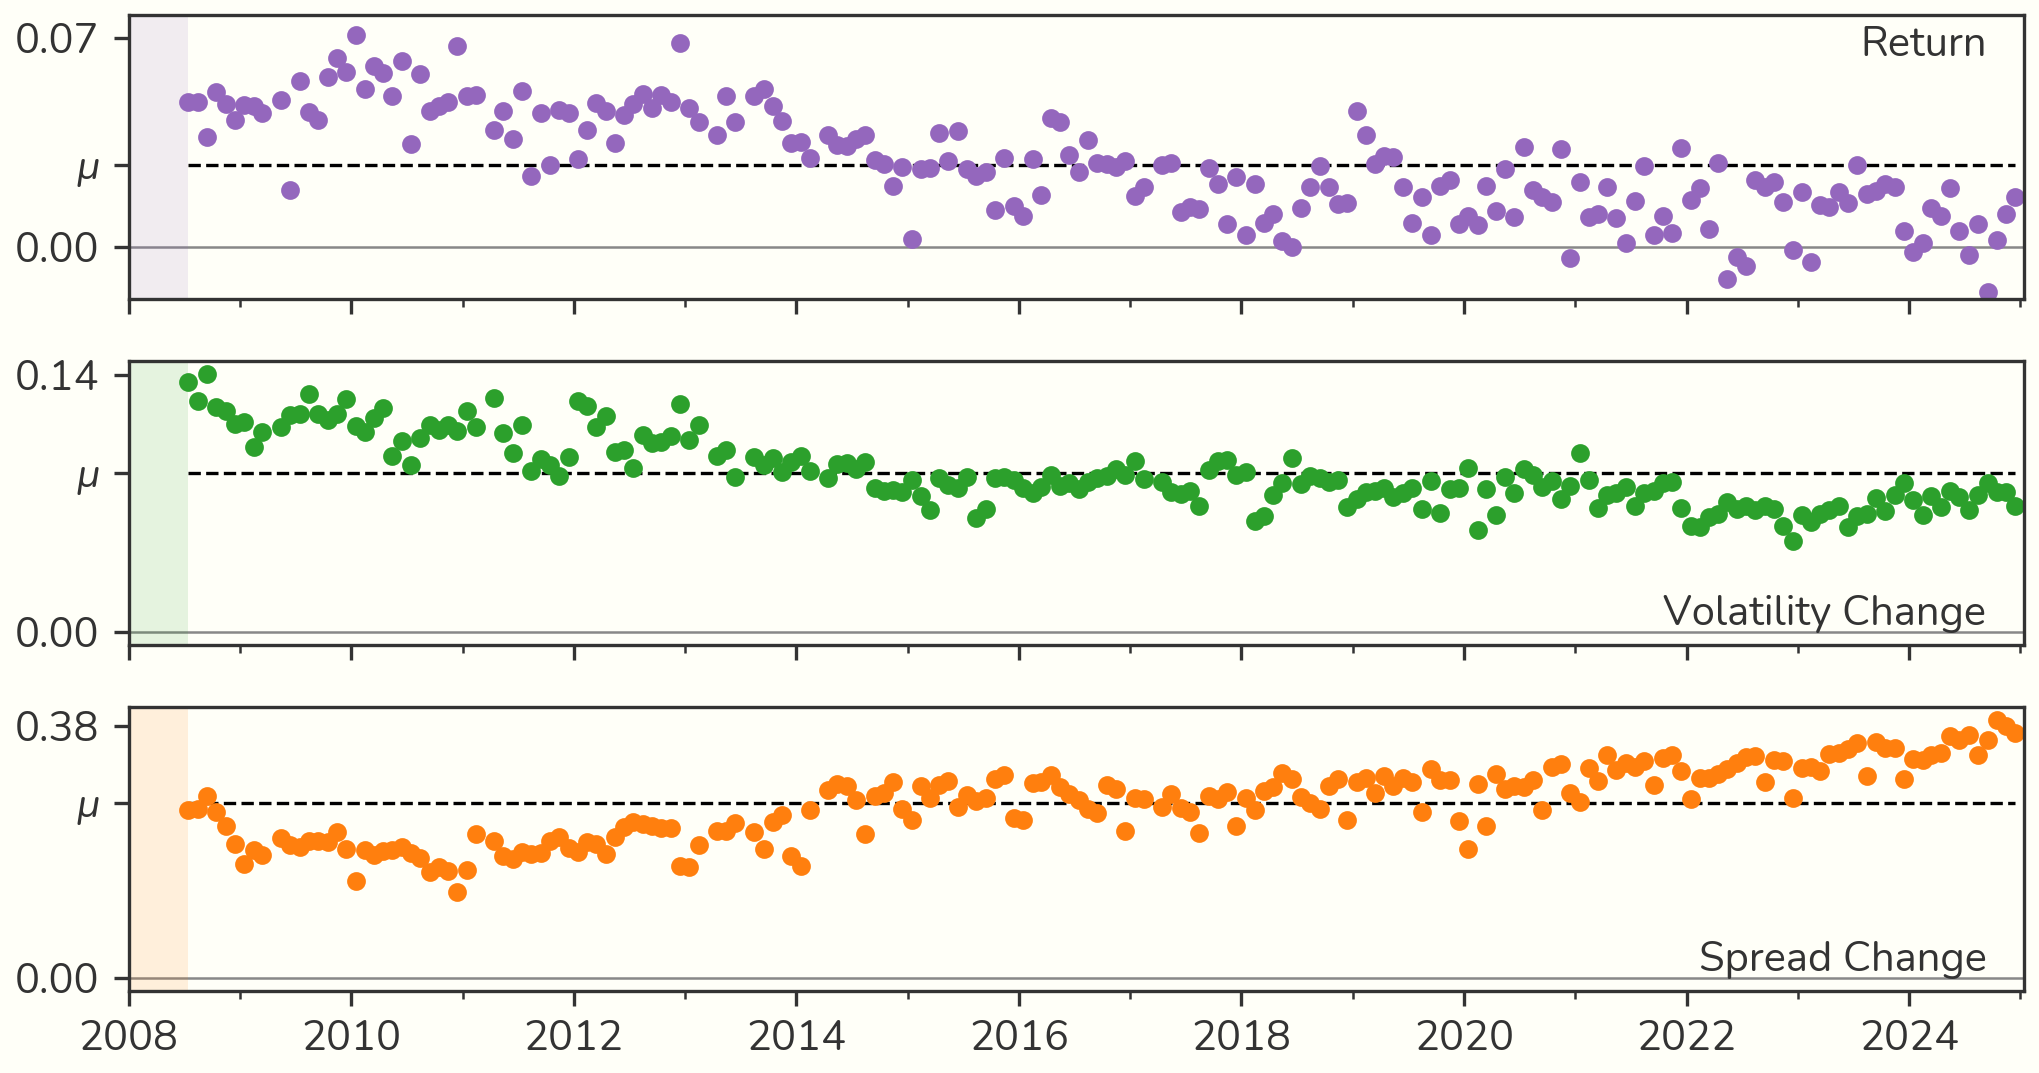
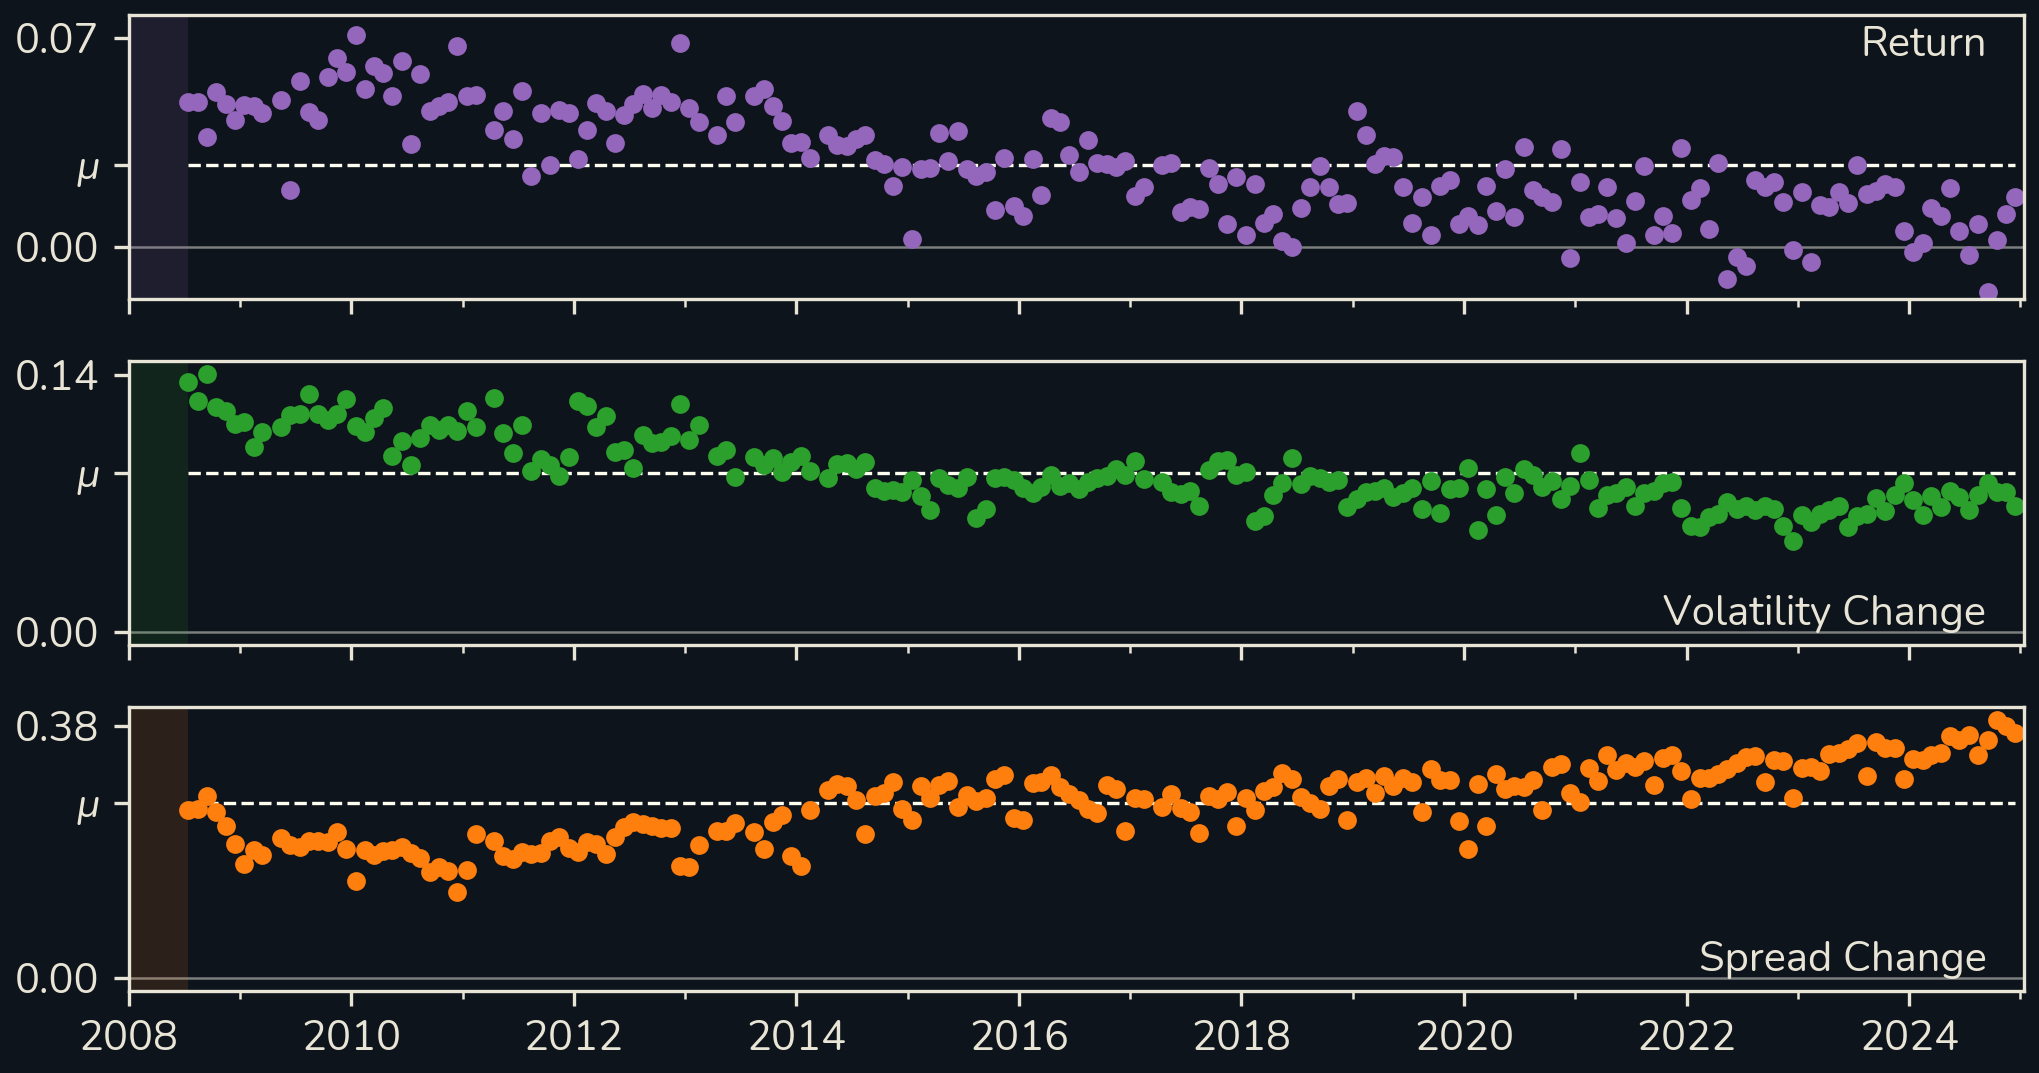
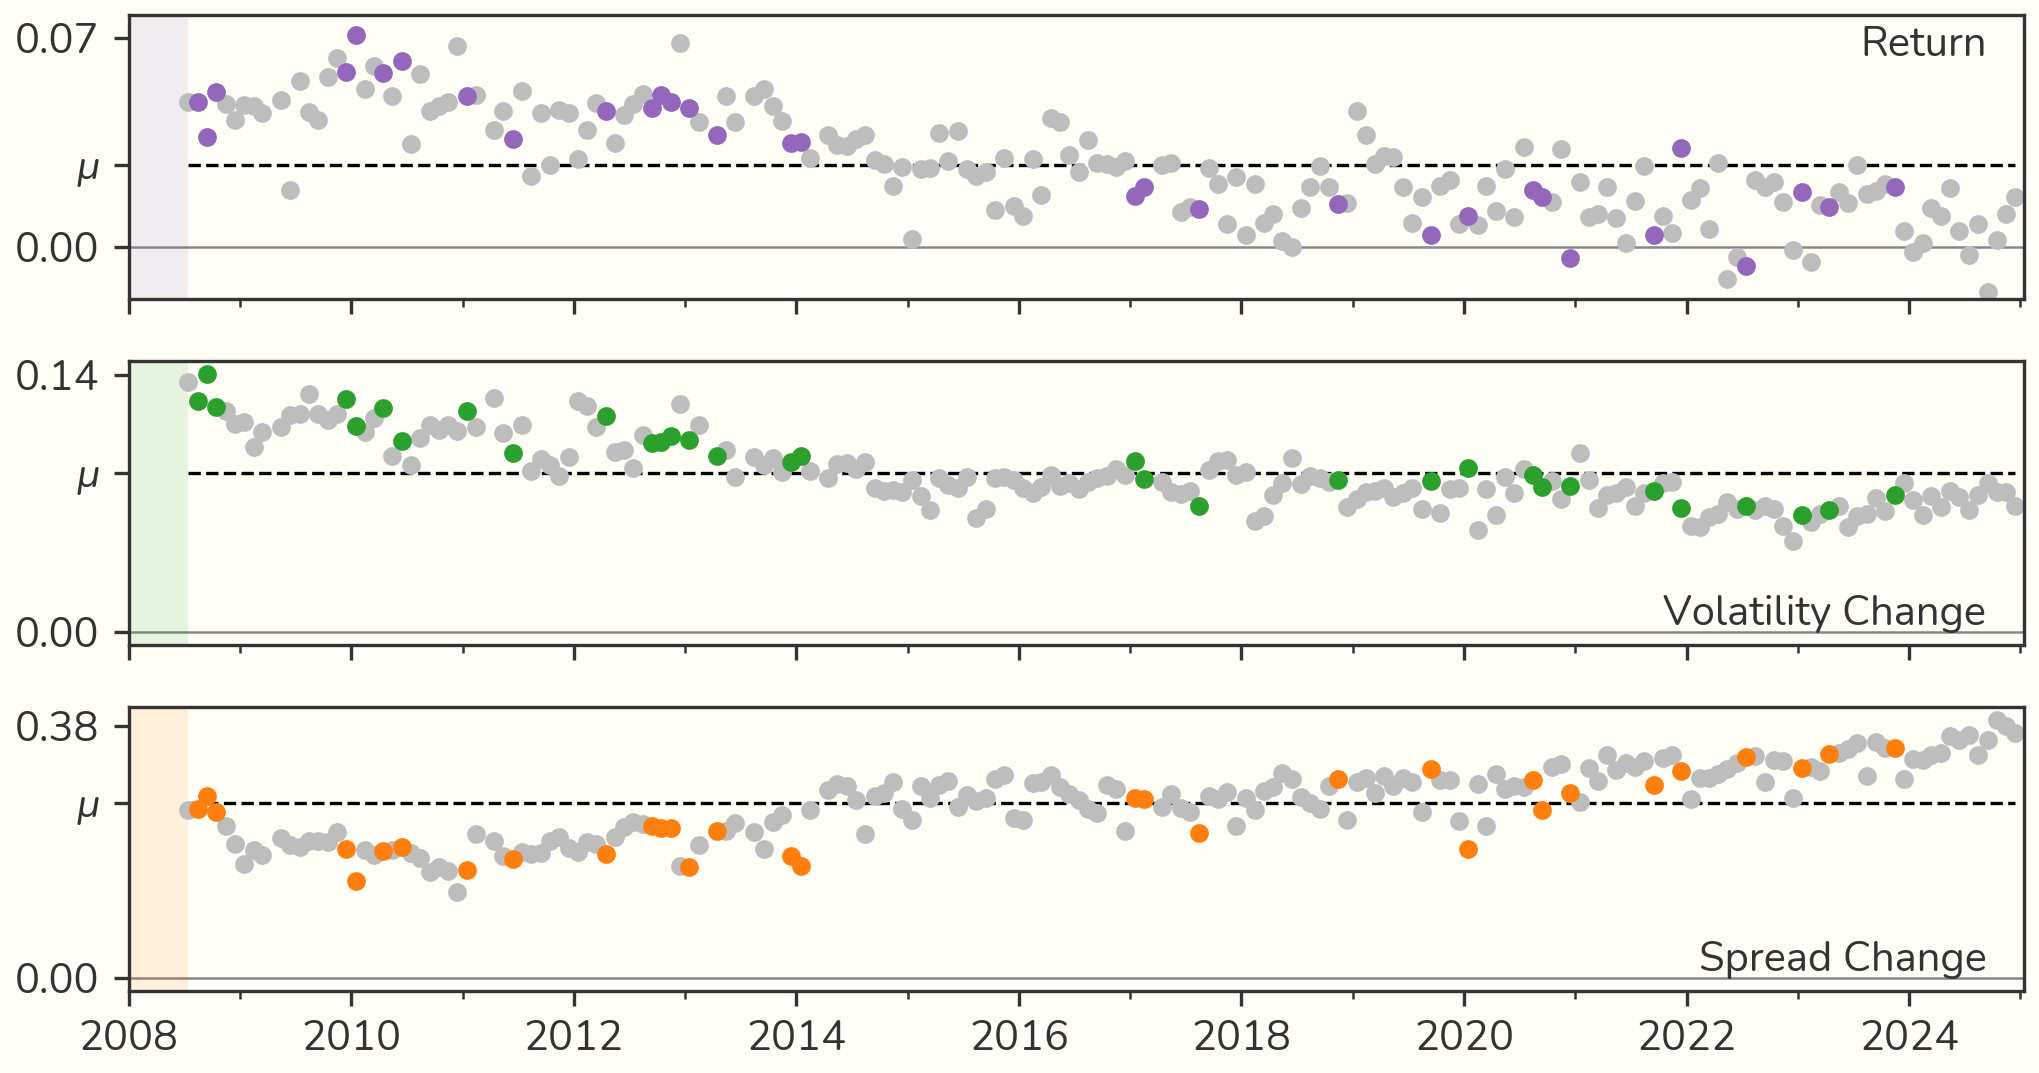
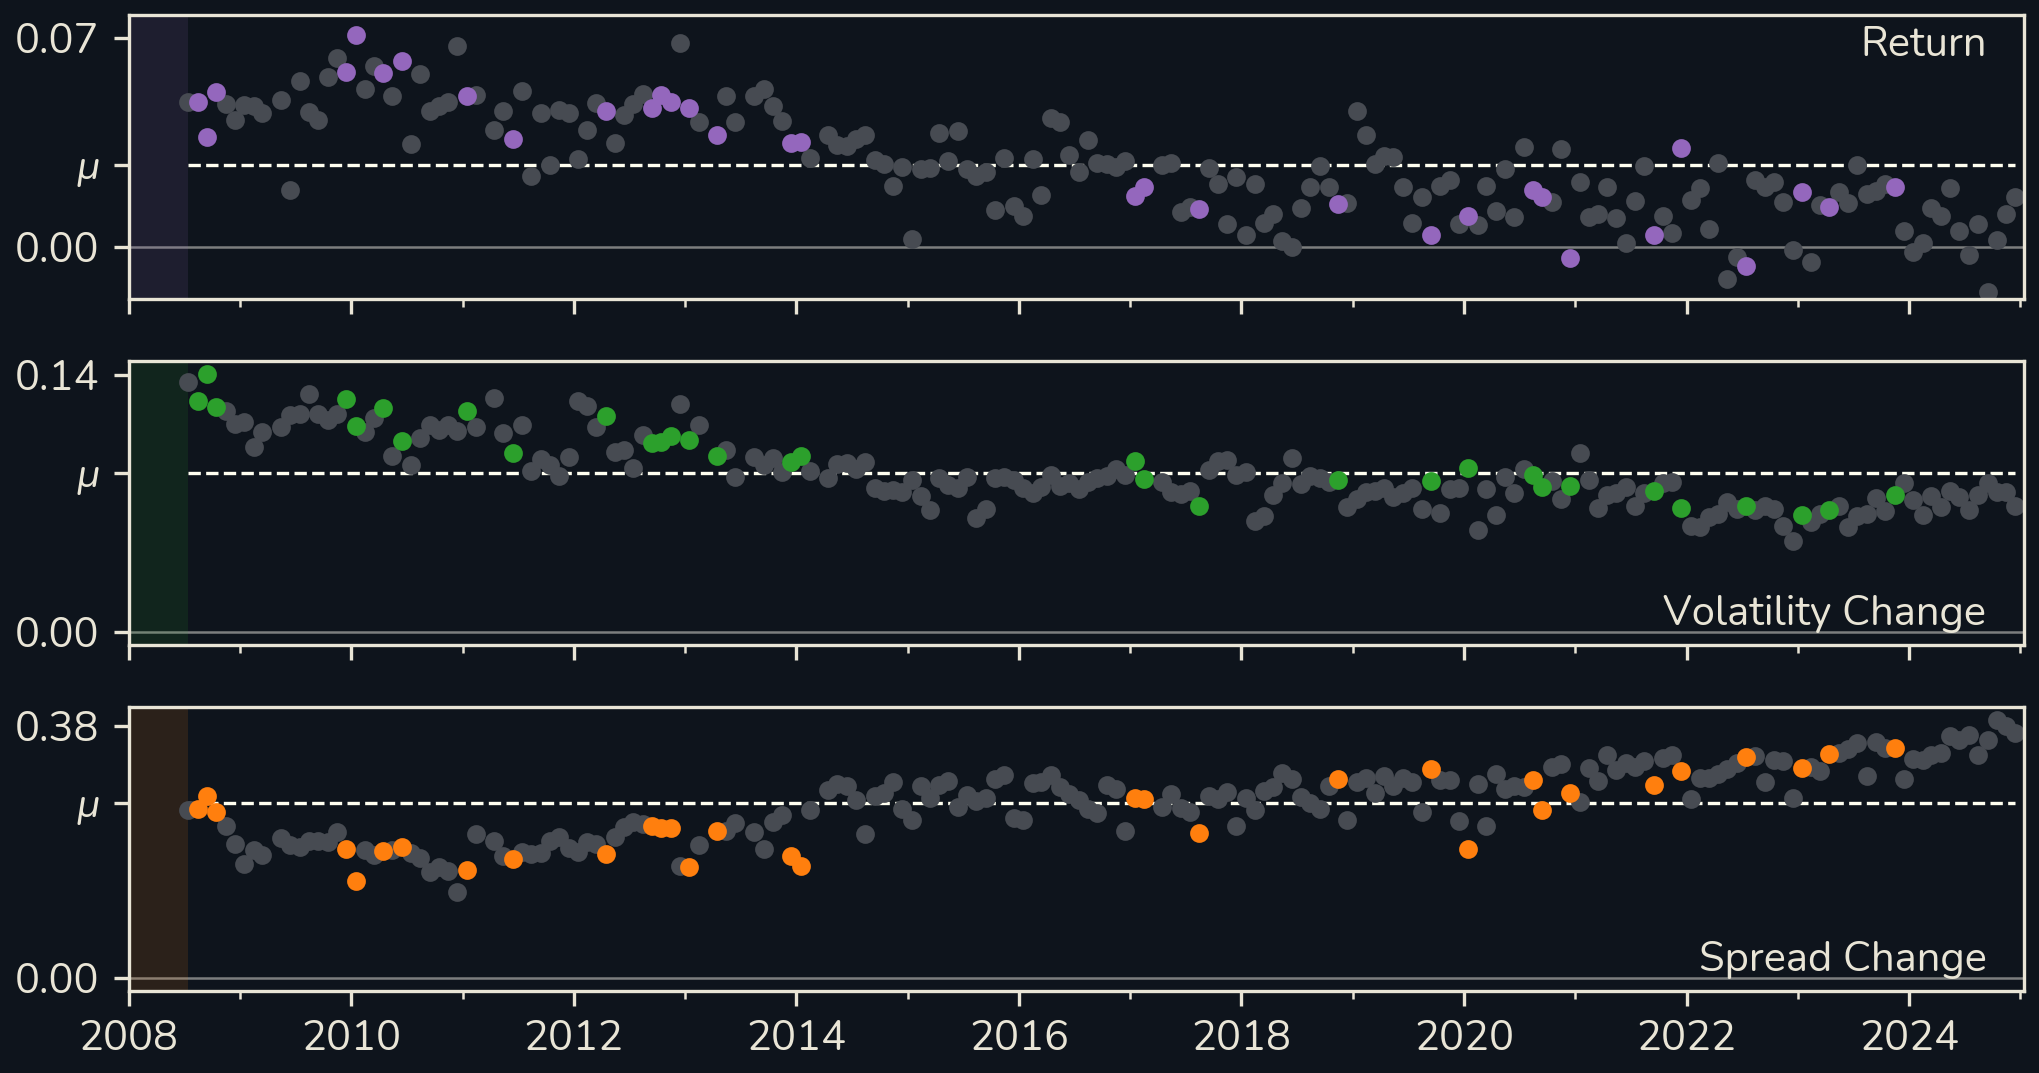
One recipe, retrained on the six months before each month and evaluated on it, across the full span. The switch picks out our 32 evaluation months.
Rigorous Evaluation Protocol
Every method is evaluated on the same 32 months and trained only on the six months before each one. We report rank IC on 15-minute return, volatility change and spread change.
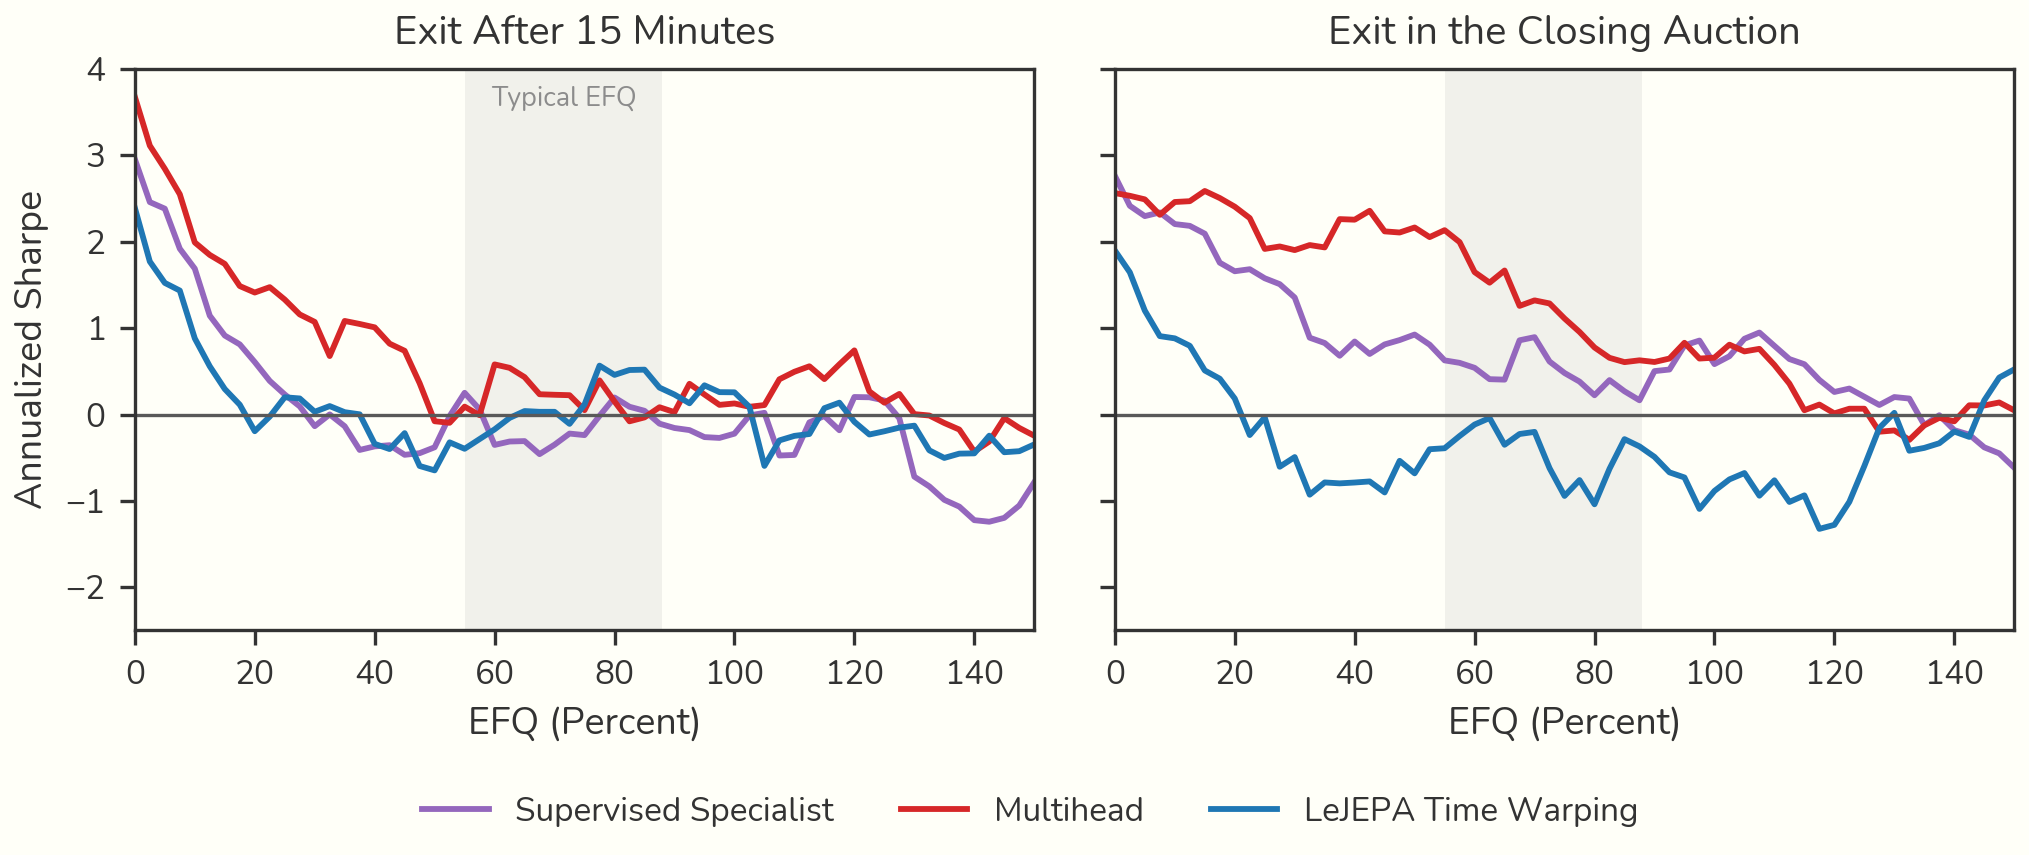
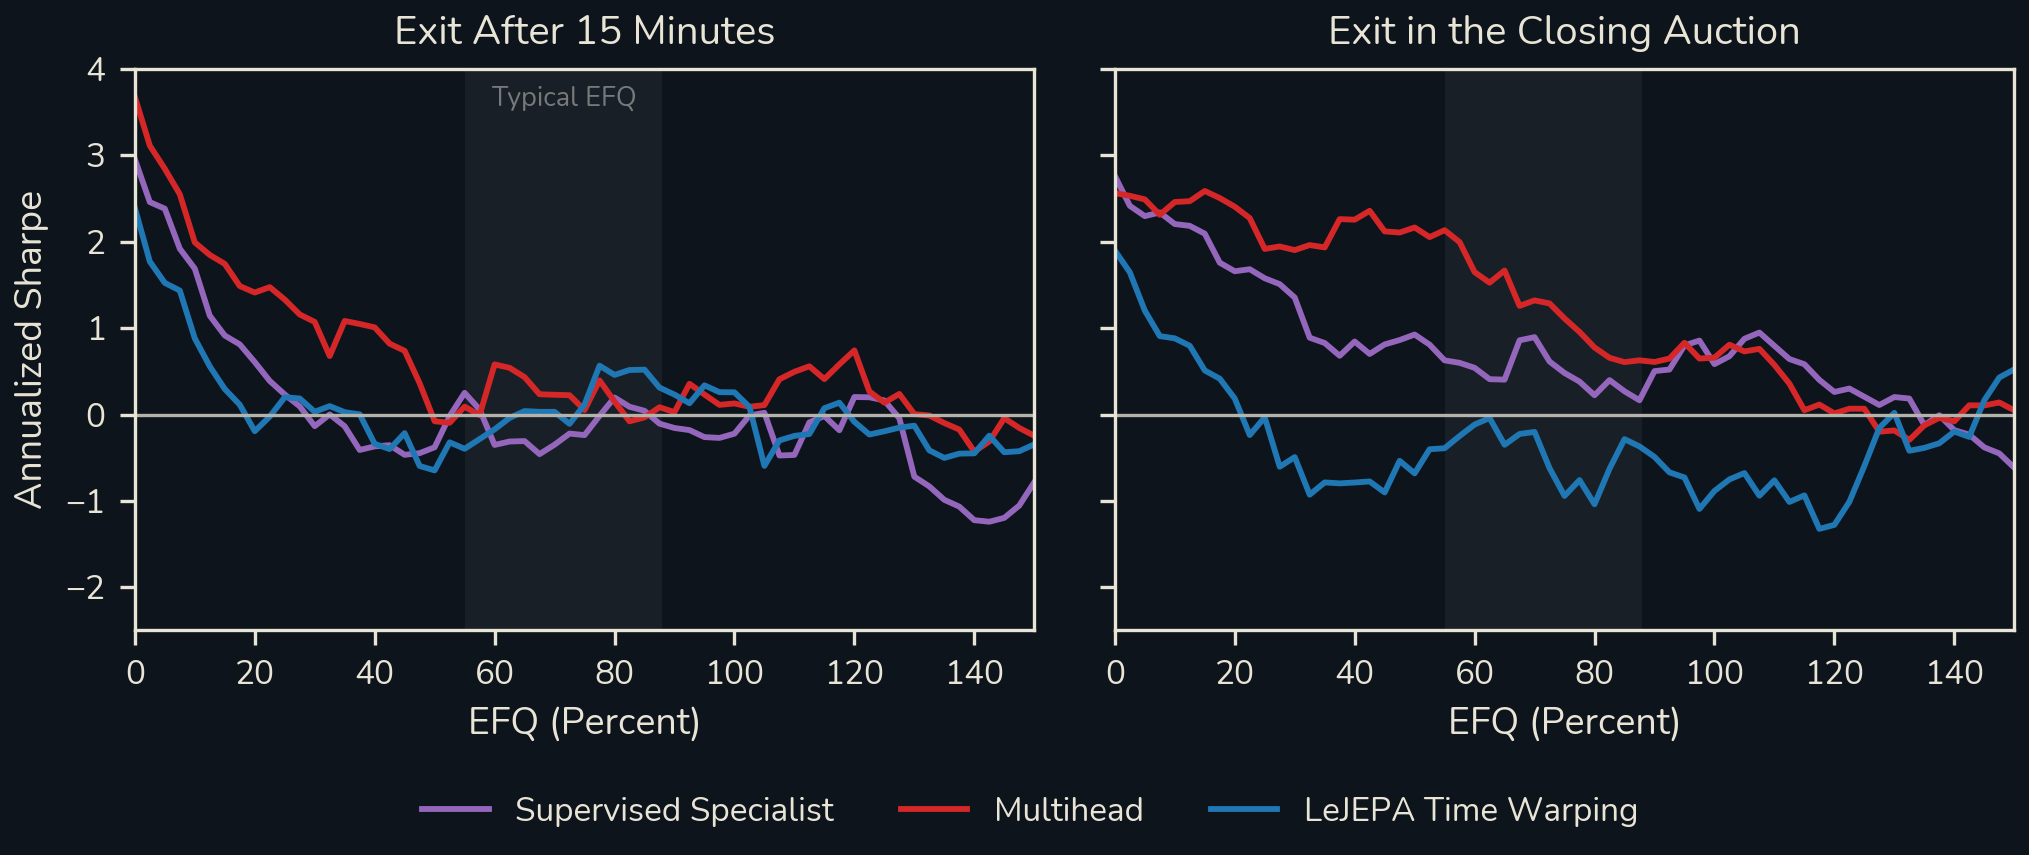
A Sharpe ratio depends not only on the forecast but on how return forecasts are translated into portfolios and trades, and on the cost and execution model.
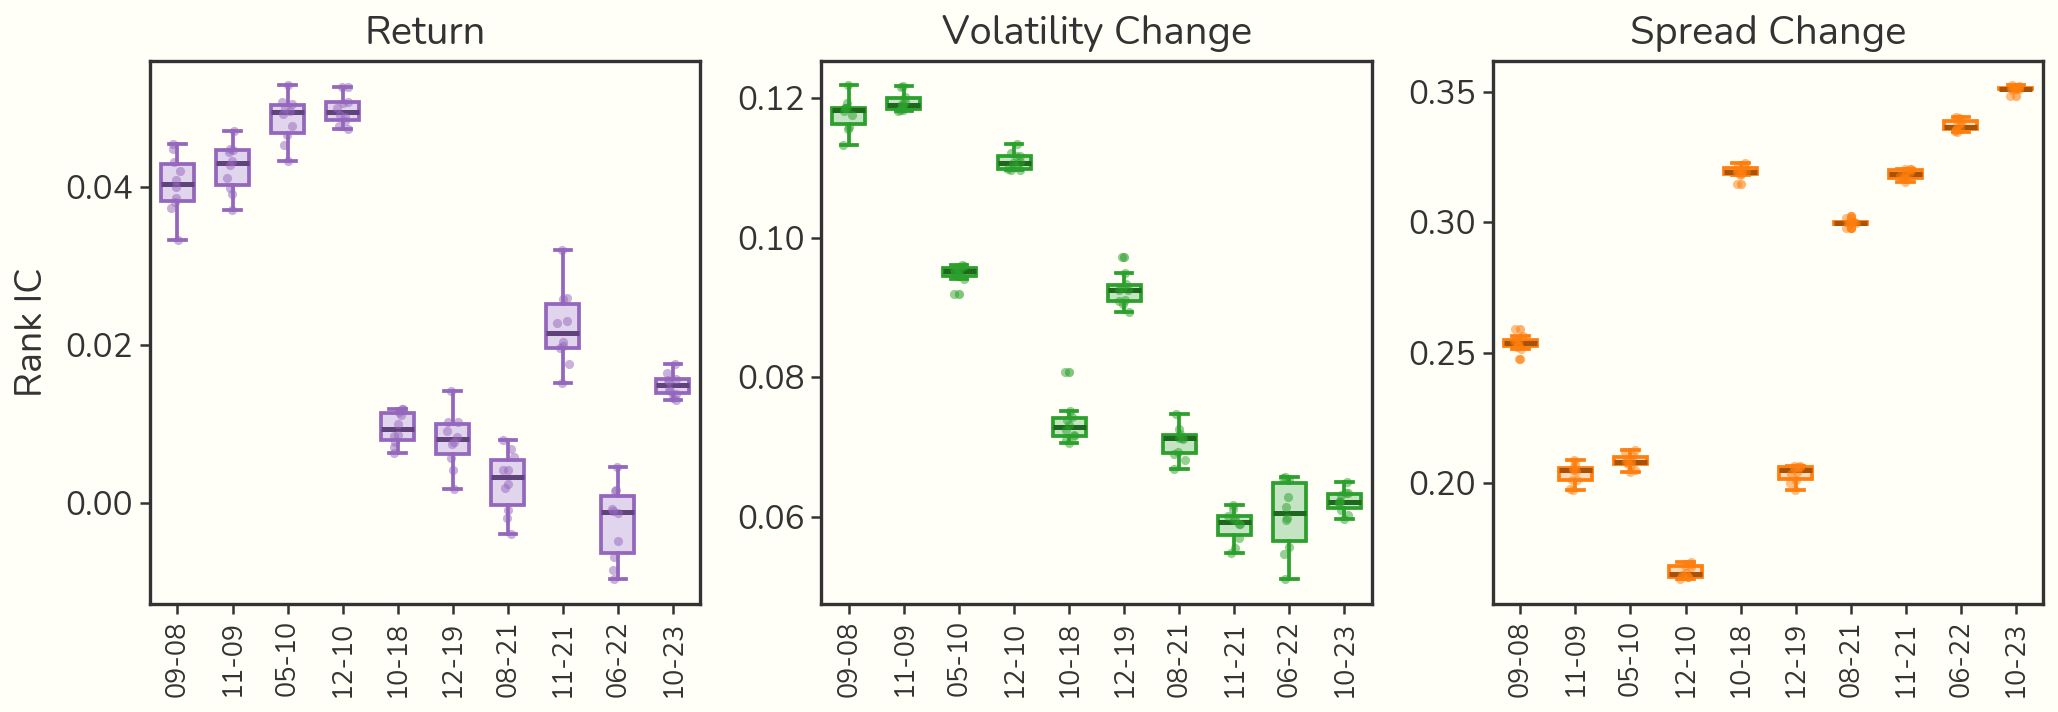
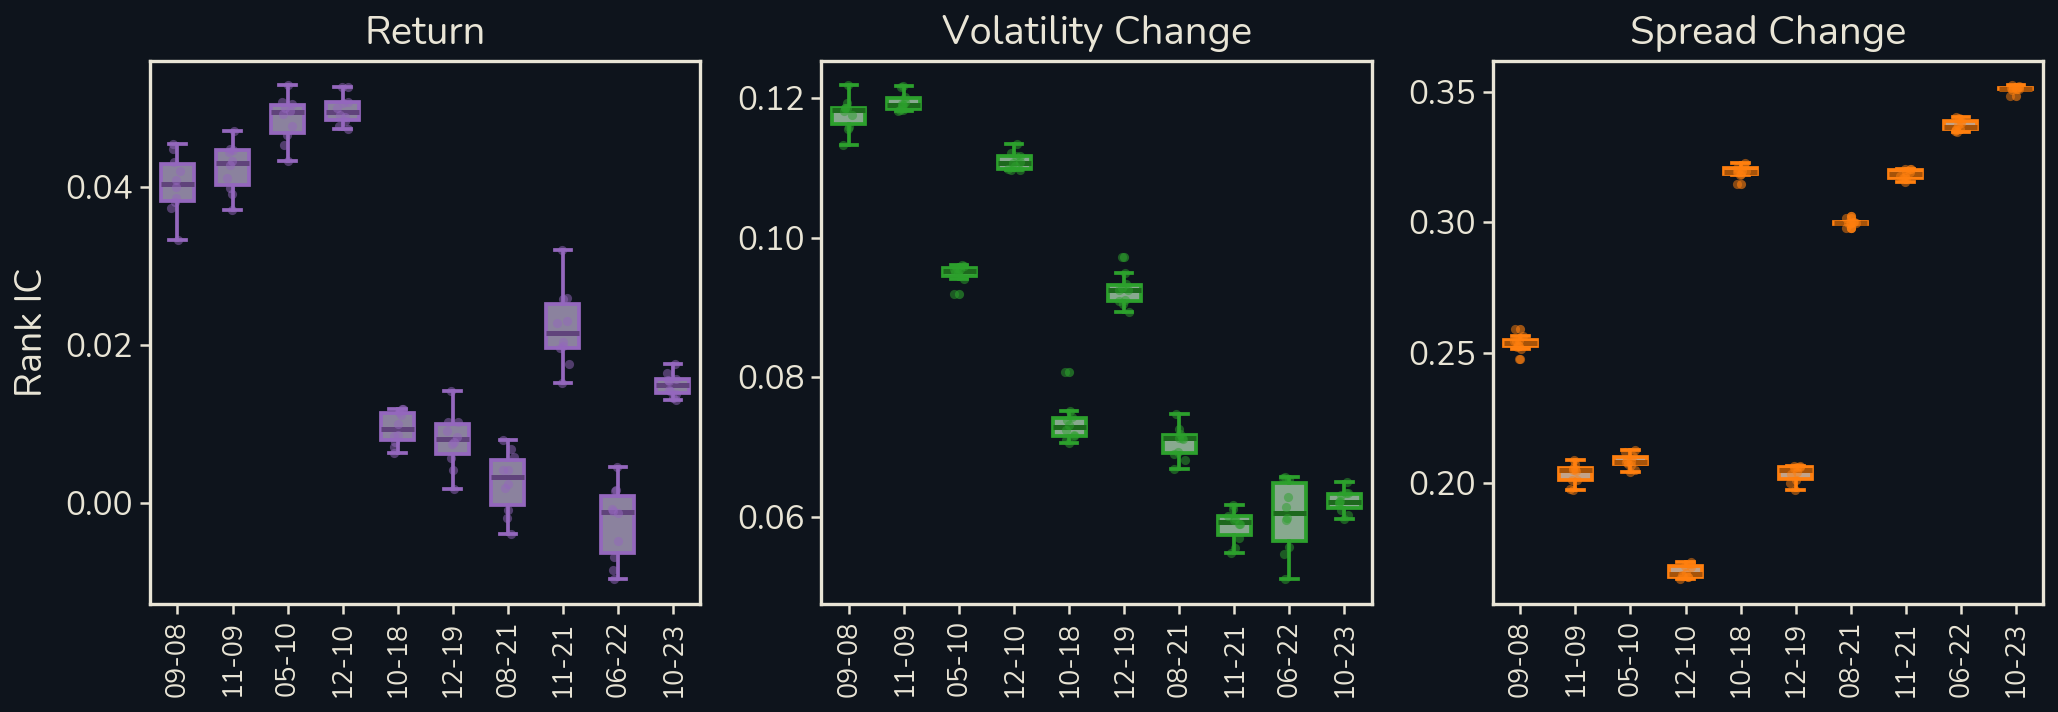
Ten seeds in each of ten months. The month explains 97.2%, 98.9% and 99.9% of the variance; the seed almost none. A single evaluation period says little about a method.
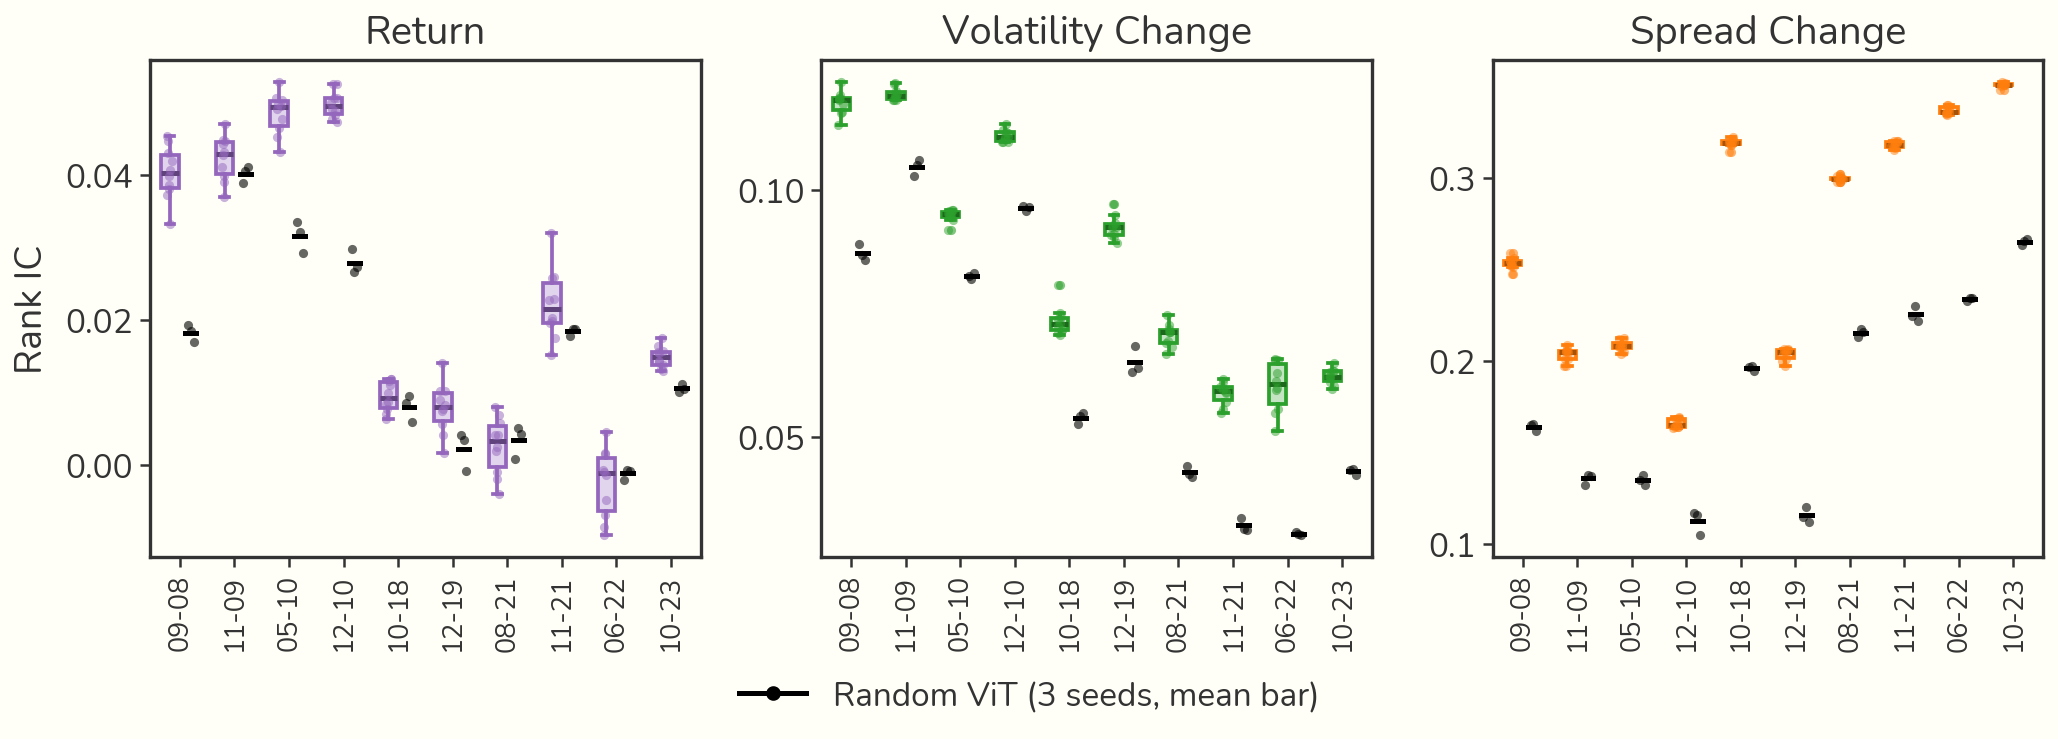
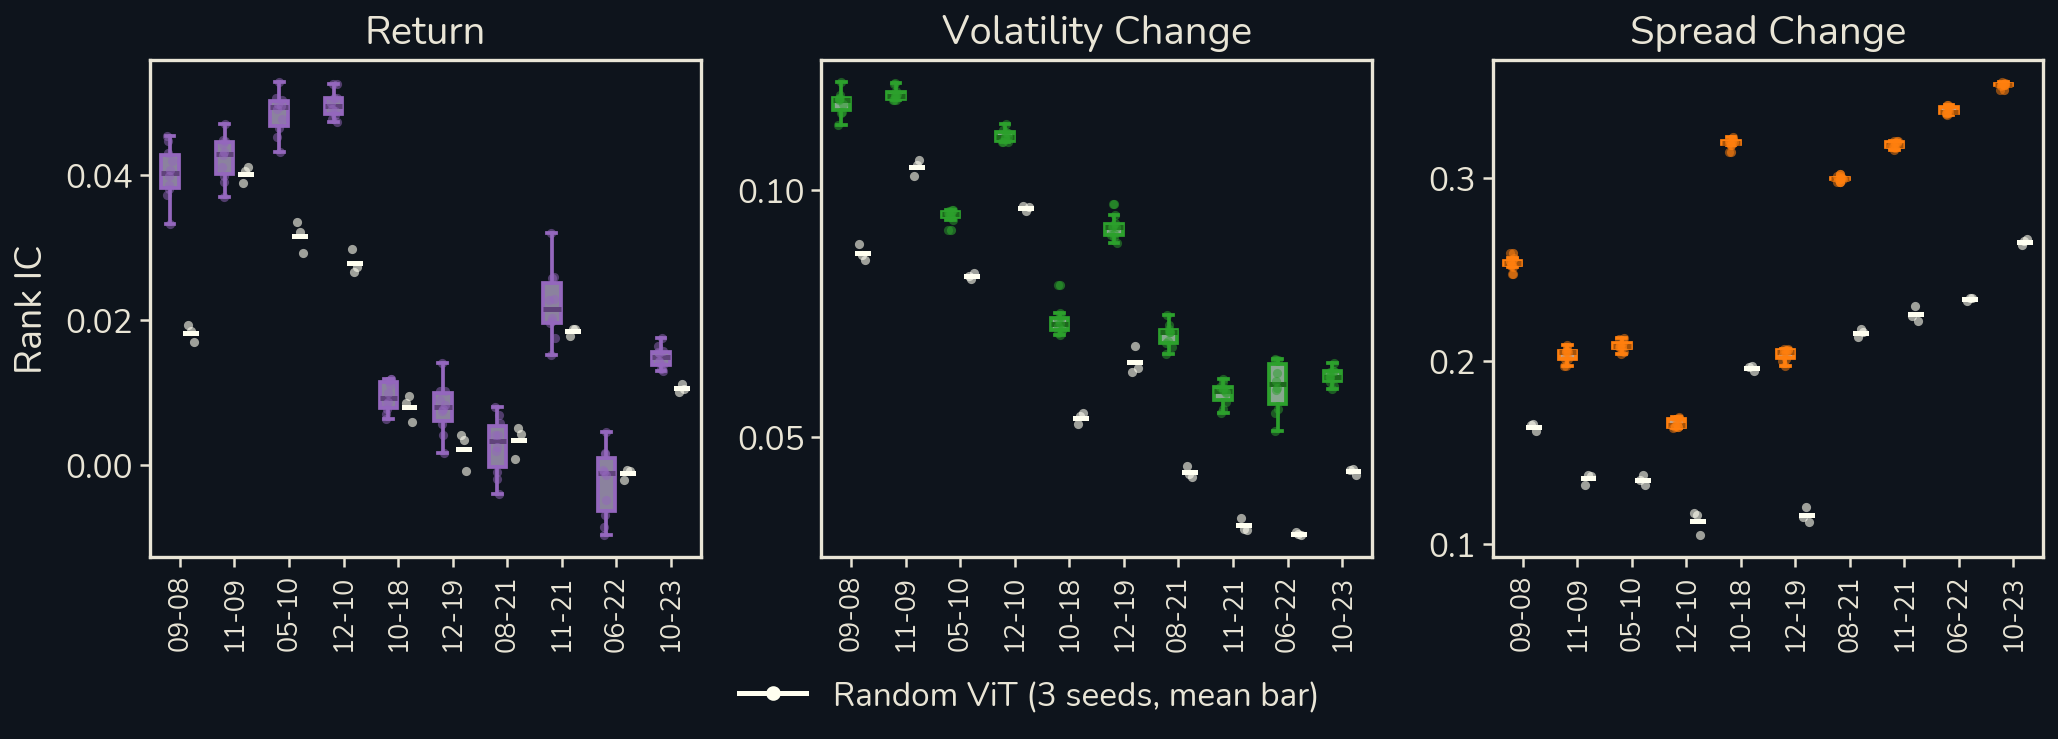
The untrained Random ViT rises and falls with the same months, so most of a month's difficulty is shared by every encoder.
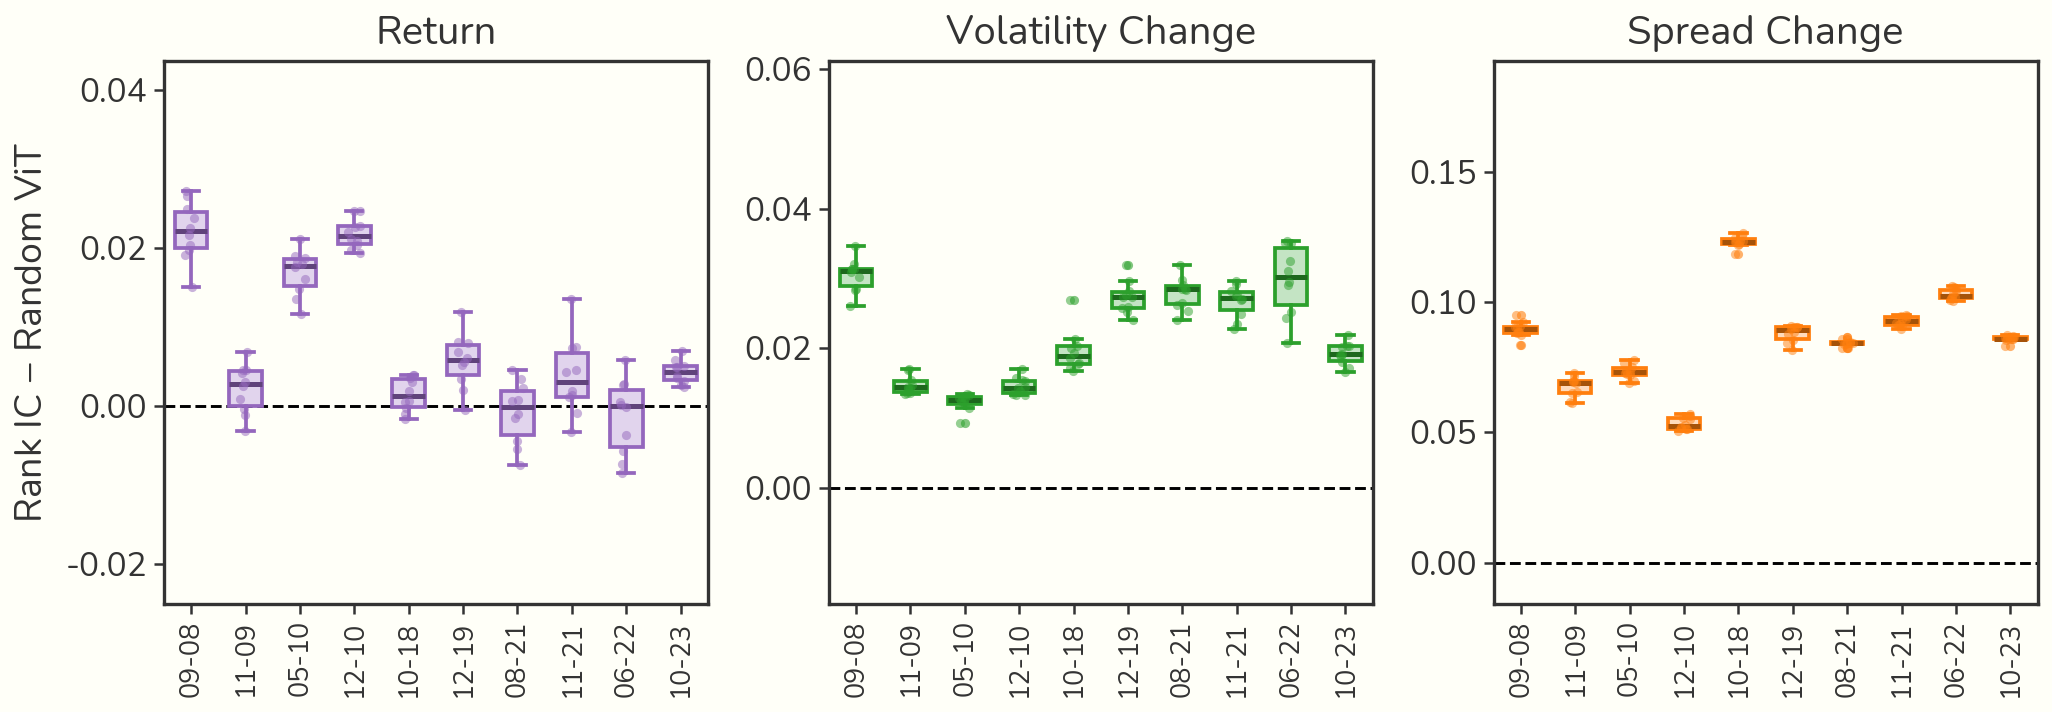
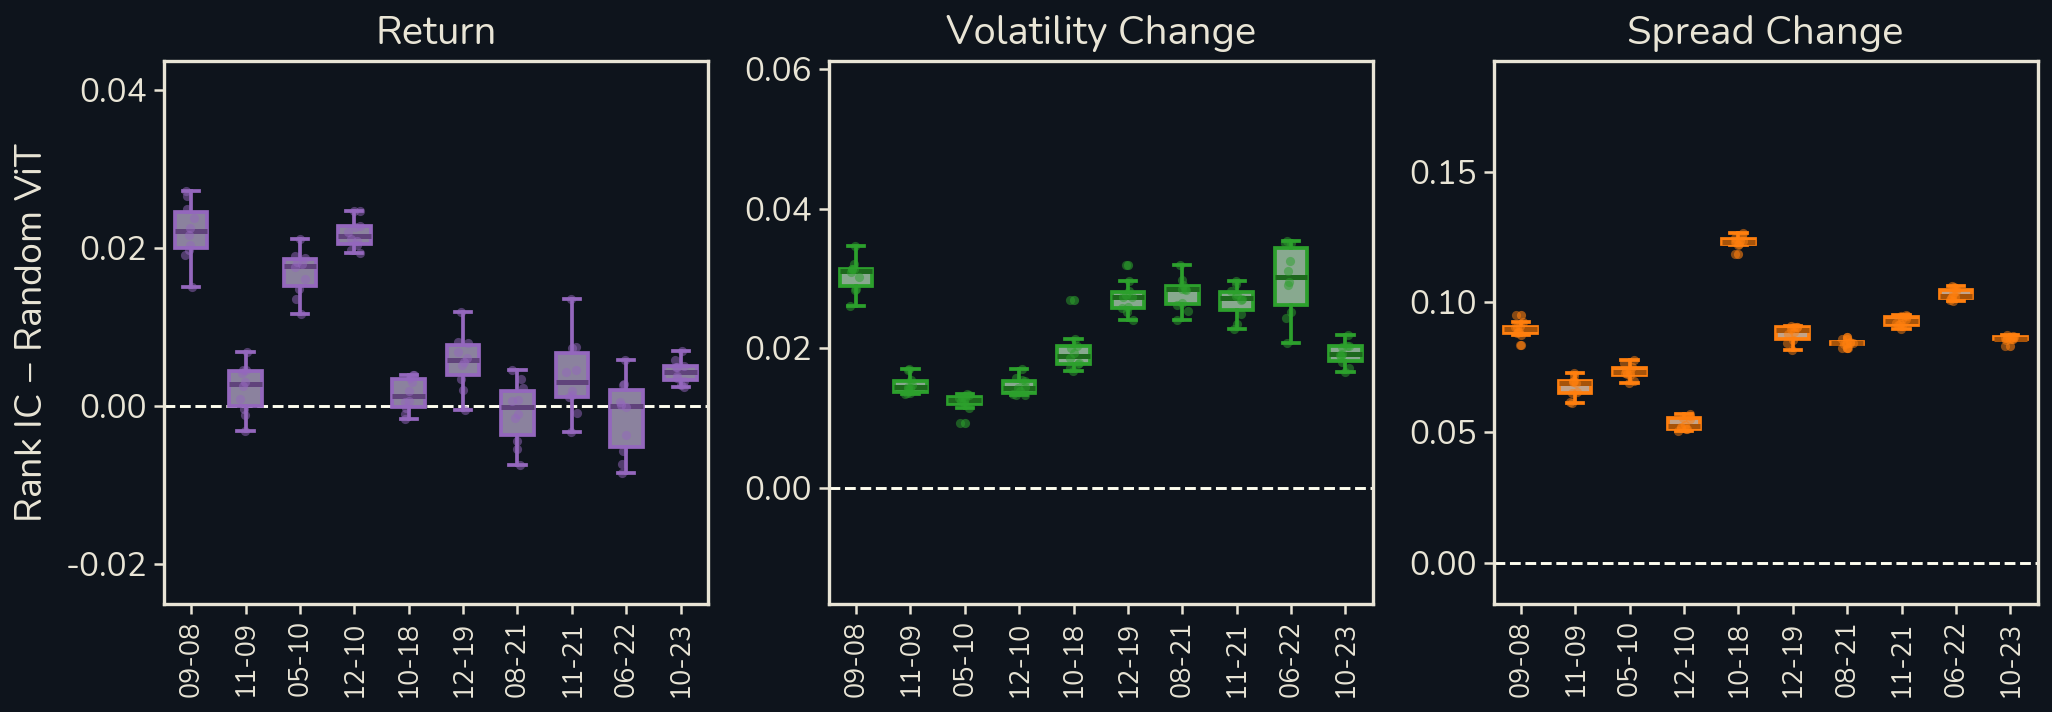
Subtracting each month's Random ViT mean removes much of the month-to-month swing. Our standard errors are computed this way.
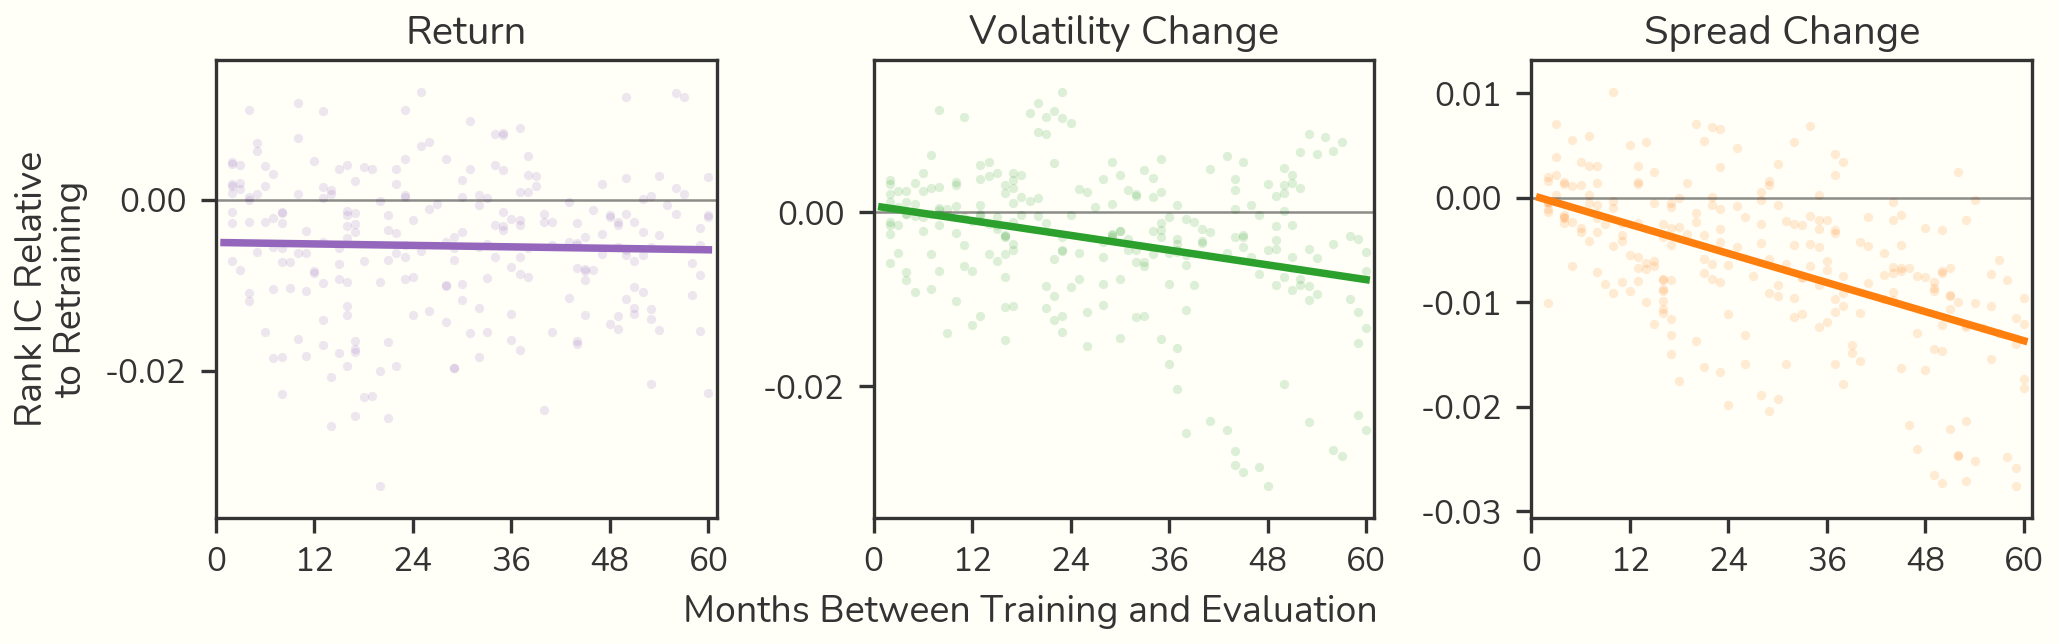
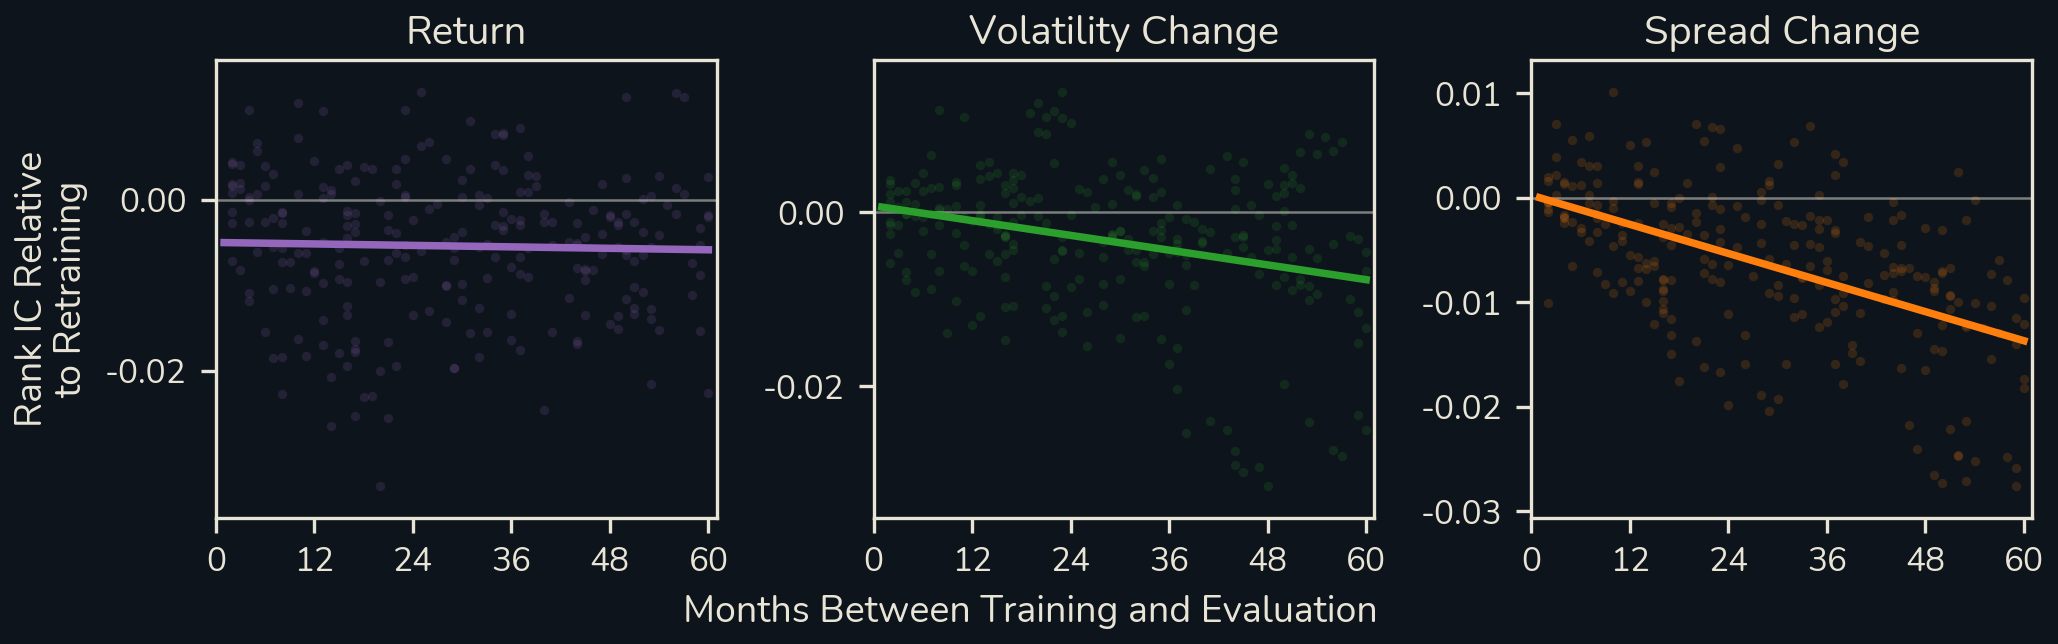
Each model is compared with the same model retrained just before the evaluation month, to control for the intrinsic difficulty of the tasks changing over time. Return holds up; volatility and spread lose about 20% and 10% of their IC over five years.
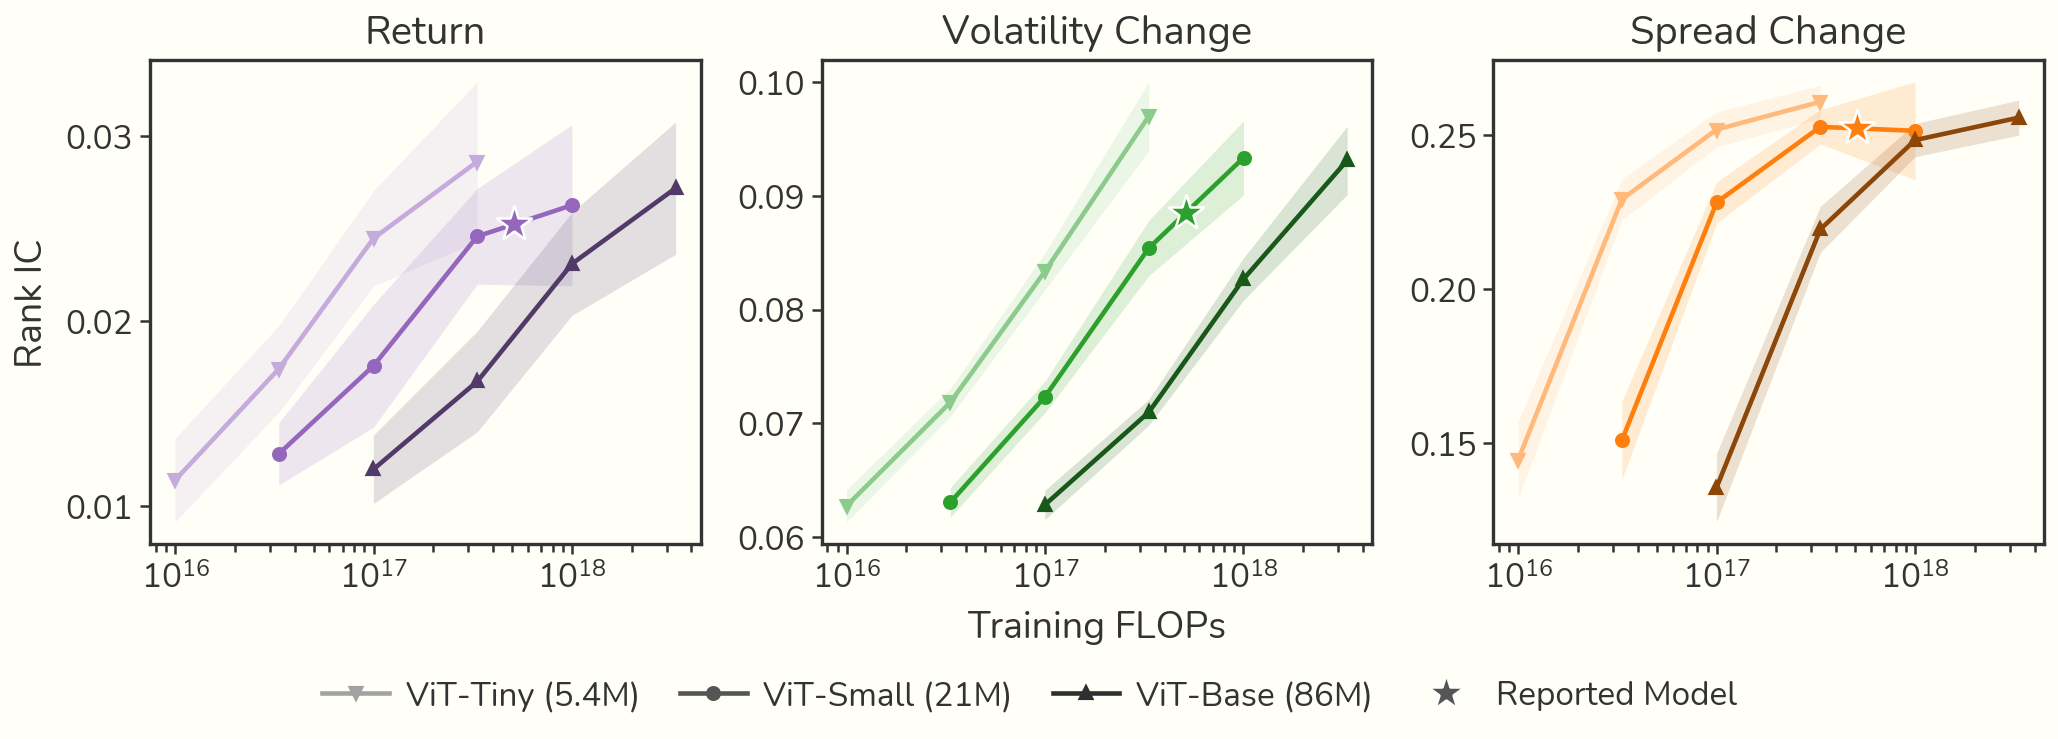
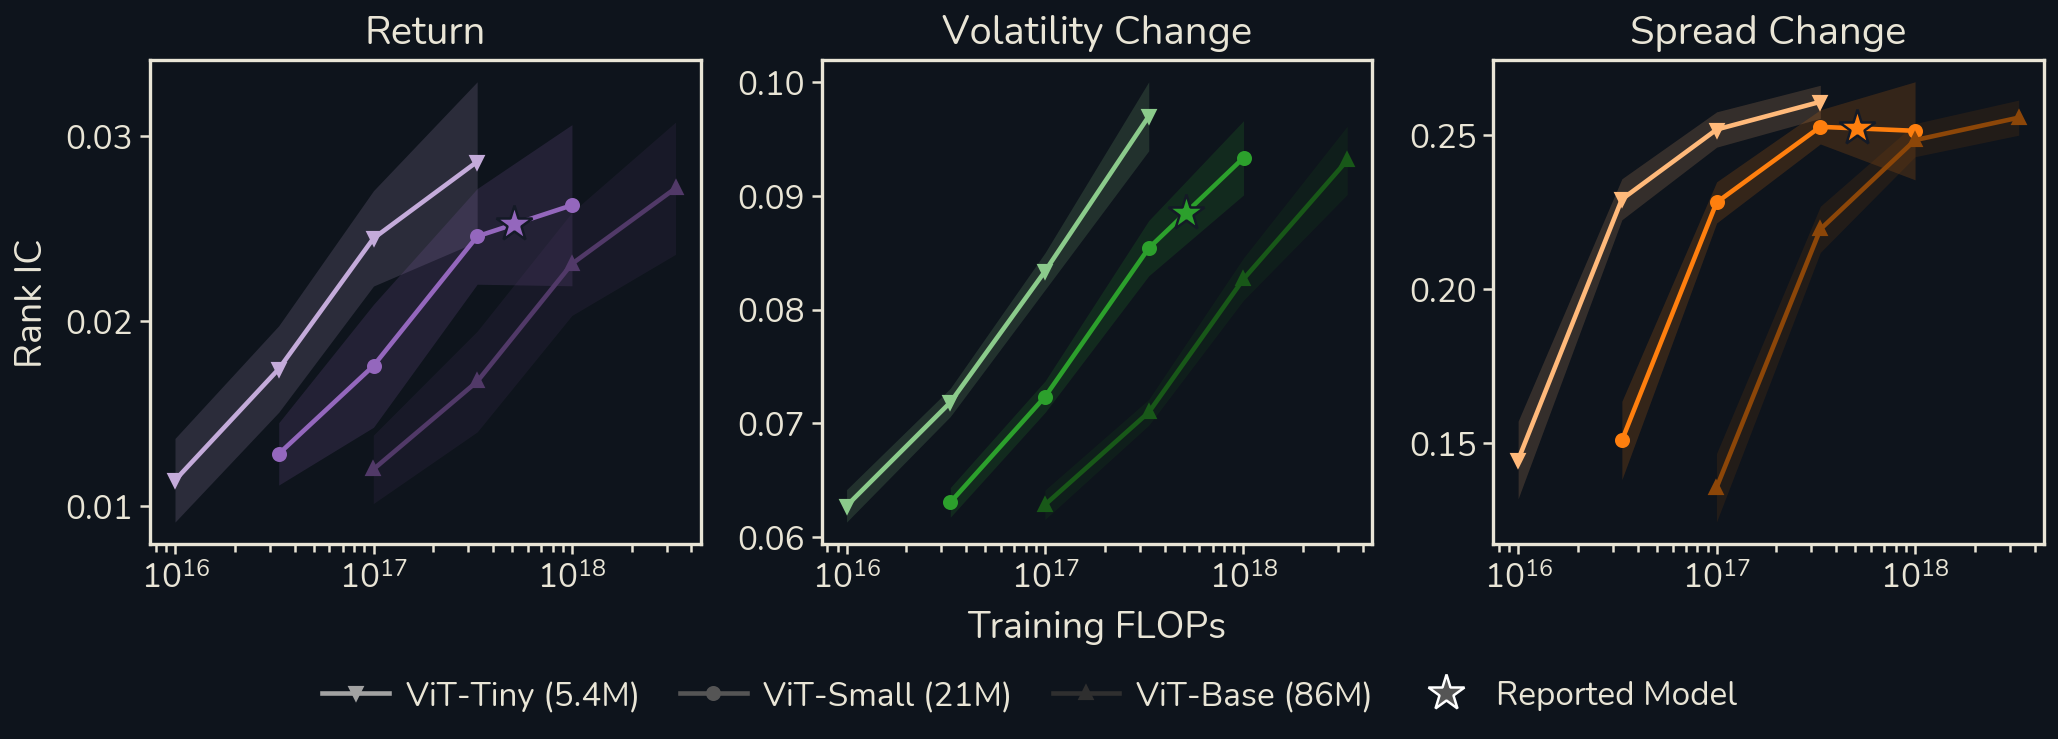
At fixed training FLOPs, smaller encoders win on every task: ViT-Tiny beats a ViT-Base trained with 10× the compute. Every point is an annealed WSD[4] checkpoint.
Self-Supervised Learning
We test different data augmentation strategies and pretraining objectives.
| Encoder | Return | Volatility | Spread |
|---|---|---|---|
| Supervised | |||
| Return | 0.0272 (0.0269) | 0.0695 | 0.1305 (below floor) |
| Volatility | 0.0197 | 0.0883 (0.0891) | 0.1480 (below floor) |
| Spread | 0.0178 | 0.0762 | 0.2517 (0.2519) |
| Multihead | 0.0311 (0.0317) | 0.0941 (0.0952) | 0.2455 (0.2441) |
| LeJEPA | |||
| Same Stock, Diff. View | 0.0182 | 0.0715 | 0.1672 (below floor) |
| Time Warping | 0.0204 | 0.0721 | 0.1691 (below floor) |
| Gaussian Noising | 0.0175 | 0.0688 (below floor) | 0.1625 (below floor) |
| Cross Stock | 0.0169 (below floor) | 0.0693 (below floor) | 0.1667 (below floor) |
| C-S, Same Industry | 0.0173 | 0.0692 (below floor) | 0.1660 (below floor) |
| SSL | |||
| DINO | 0.0097 (below floor) | 0.0310 (below floor) | 0.0626 (below floor) |
| BYOL | 0.0104 (below floor) | 0.0314 (below floor) | 0.0686 (below floor) |
| CPC | 0.0184 | 0.0697 | 0.1519 (below floor) |
| I-JEPA | 0.0103 (below floor) | 0.0256 (below floor) | 0.0646 (below floor) |
| MAE | 0.0181 | 0.0684 (below floor) | 0.1435 (below floor) |
| TS2Vec | 0.0205 | 0.0719 | 0.1500 (below floor) |
| CoST | 0.0100 (below floor) | 0.0339 (below floor) | 0.0302 (below floor) |
| TF-C | 0.0095 (below floor) | 0.0570 (below floor) | 0.1171 (below floor) |
| TimeMAE | 0.0199 | 0.0706 | 0.1408 (below floor) |
| Untrained floor | |||
| Random ViT | 0.0170 | 0.0694 | 0.1692 |
Organization
We embed views of six firms from three industries within one evaluation month and ask whether nearby embeddings share a partner, a day, a firm or an industry.

| Encoder | Partner Matched View | Own-Day Centroid | Own-Firm Centroid | Partner Firm Centroid |
|---|---|---|---|---|
| Supervised | ||||
| Return | 2.26× / 44.3% | 1.76× / 42.8% | 1.25× (below floor) / 45.6% (below floor) | 1.17× / 47.3% (below floor) |
| Vol | 2.13× / 44.8% | 1.70× / 43.2% | 1.91× / 33.9% | 1.27× / 45.6% |
| Spread | 1.65× (below floor) / 46.3% (below floor) | 1.45× (below floor) / 45.5% (below floor) | 2.41× / 26.1% | 1.15× (below floor) / 47.0% (below floor) |
| Multihead | 2.25× / 44.4% | 1.70× / 43.6% | 2.35× / 28.6% | 1.38× / 43.8% |
| LeJEPA | ||||
| Same Stock, Diff. View | 1.65× (below floor) / 45.0% | 1.31× (below floor) / 46.0% (below floor) | 5.36× / 2.5% | 1.23× / 45.5% |
| Time Warping | 1.97× / 39.7% | 2.01× / 37.7% | 1.54× (below floor) / 40.9% (below floor) | 1.07× (below floor) / 47.5% (below floor) |
| Gaussian Noising | 2.33× / 41.1% | 2.03× / 39.2% | 1.59× (below floor) / 38.6% (below floor) | 1.12× (below floor) / 47.3% (below floor) |
| Cross Stock | 2.46× / 40.5% | 2.09× / 38.4% | 1.55× (below floor) / 39.3% (below floor) | 1.13× (below floor) / 47.6% (below floor) |
| C-S, Same Industry | 2.58× / 39.7% | 2.22× / 37.6% | 1.52× (below floor) / 39.9% (below floor) | 1.12× (below floor) / 47.3% (below floor) |
| SSL | ||||
| DINO | 2.28× / 39.6% | 2.04× / 37.9% | 1.49× (below floor) / 40.5% (below floor) | 1.23× / 46.1% |
| BYOL | 2.23× / 41.0% | 1.94× / 39.1% | 1.72× (below floor) / 36.4% (below floor) | 1.19× / 46.4% |
| CPC | 2.07× / 46.2% (below floor) | 1.57× / 45.1% (below floor) | 1.55× (below floor) / 40.3% (below floor) | 1.15× (below floor) / 48.1% (below floor) |
| I-JEPA | 2.24× / 40.5% | 1.89× / 39.5% | 1.06× (below floor) / 49.0% (below floor) | 1.24× / 45.1% |
| MAE | 2.42× / 40.2% | 2.10× / 38.5% | 1.23× (below floor) / 45.4% (below floor) | 1.22× / 46.7% (below floor) |
| TS2Vec | 1.86× / 43.5% | 1.47× (below floor) / 44.4% | 3.99× / 11.0% | 1.37× / 43.2% |
| CoST | 2.13× / 40.6% | 2.00× / 38.1% | 1.03× (below floor) / 49.6% (below floor) | 1.17× / 47.4% (below floor) |
| TF-C | 2.15× / 45.6% (below floor) | 1.55× / 45.0% (below floor) | 4.14× / 10.6% | 1.39× / 44.7% |
| TimeMAE | 3.35× / 38.6% | 2.66× / 36.0% | 1.32× (below floor) / 43.9% (below floor) | 1.33× / 44.6% |
| Frozen time-series foundation models | ||||
| Chronos-2 | 2.24× / 42.5% | 1.88× / 39.9% | 2.56× / 24.9% | 1.07× (below floor) / 48.4% (below floor) |
| Kronos | 2.90× / 41.1% | 2.27× / 38.6% | 1.43× (below floor) / 42.2% (below floor) | 1.40× / 44.2% |
| TimesFM 3.0 | 1.95× / 44.2% | 1.55× / 43.4% | 2.43× / 28.2% | 1.22× / 45.4% |
| Untrained floor | ||||
| Random ViT | 1.82× / 45.6% | 1.48× / 44.4% | 1.81× / 36.2% | 1.16× / 46.6% |
Factor Structure
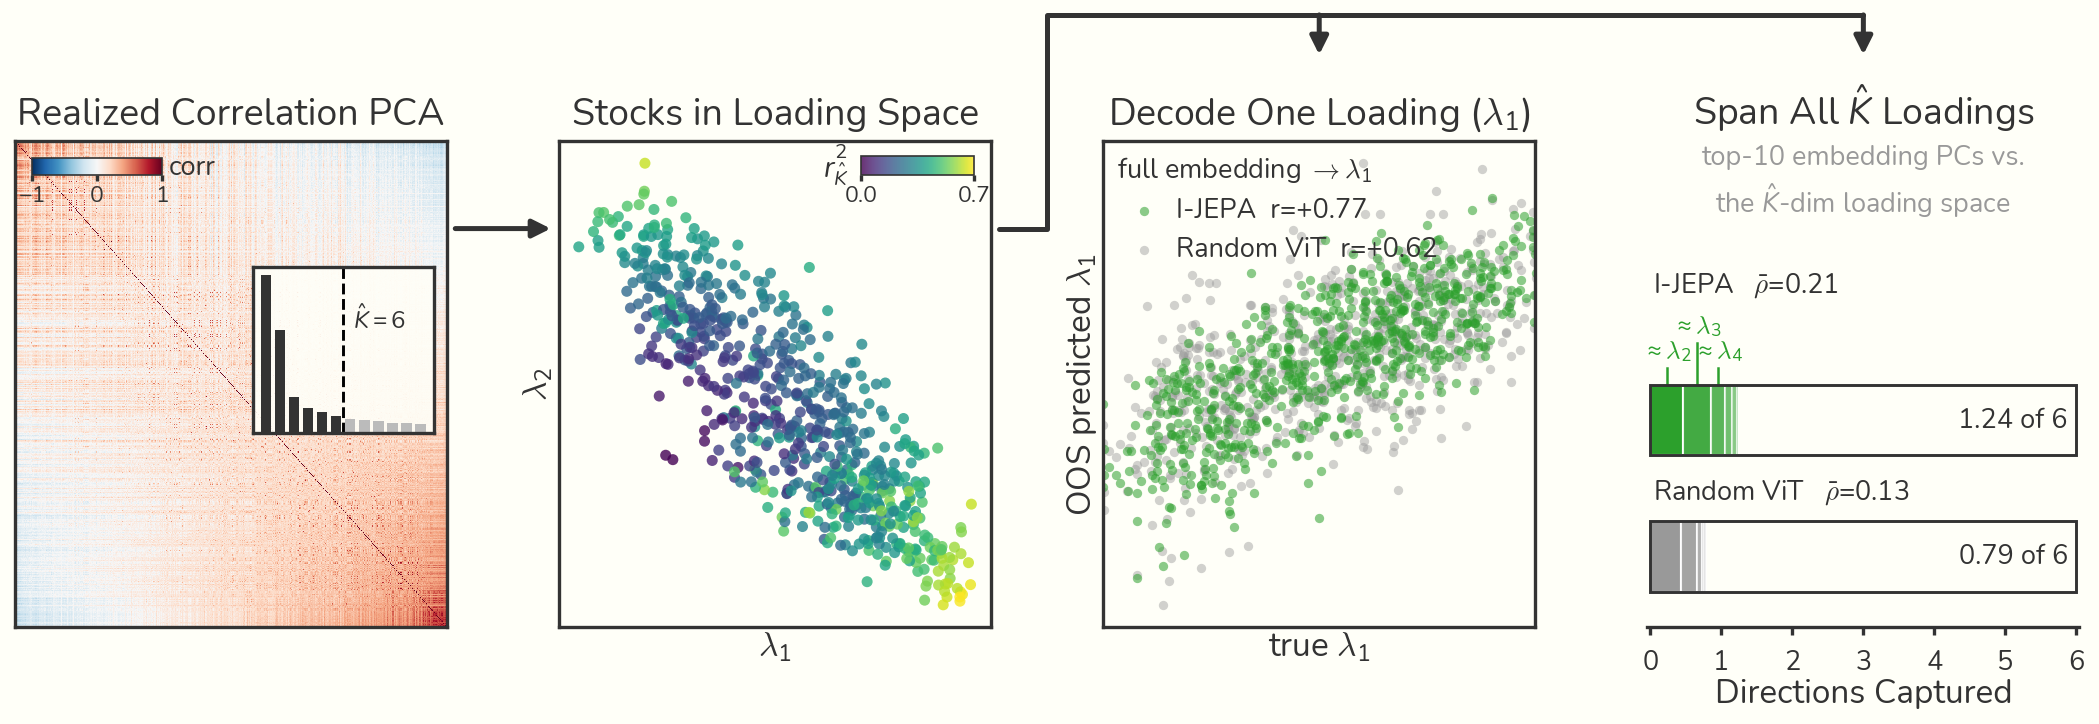
We estimate statistical factors from the month's realized returns[5] and ask whether each firm's loadings can be decoded from its embedding, and whether the embedding's leading directions span the factor subspace.
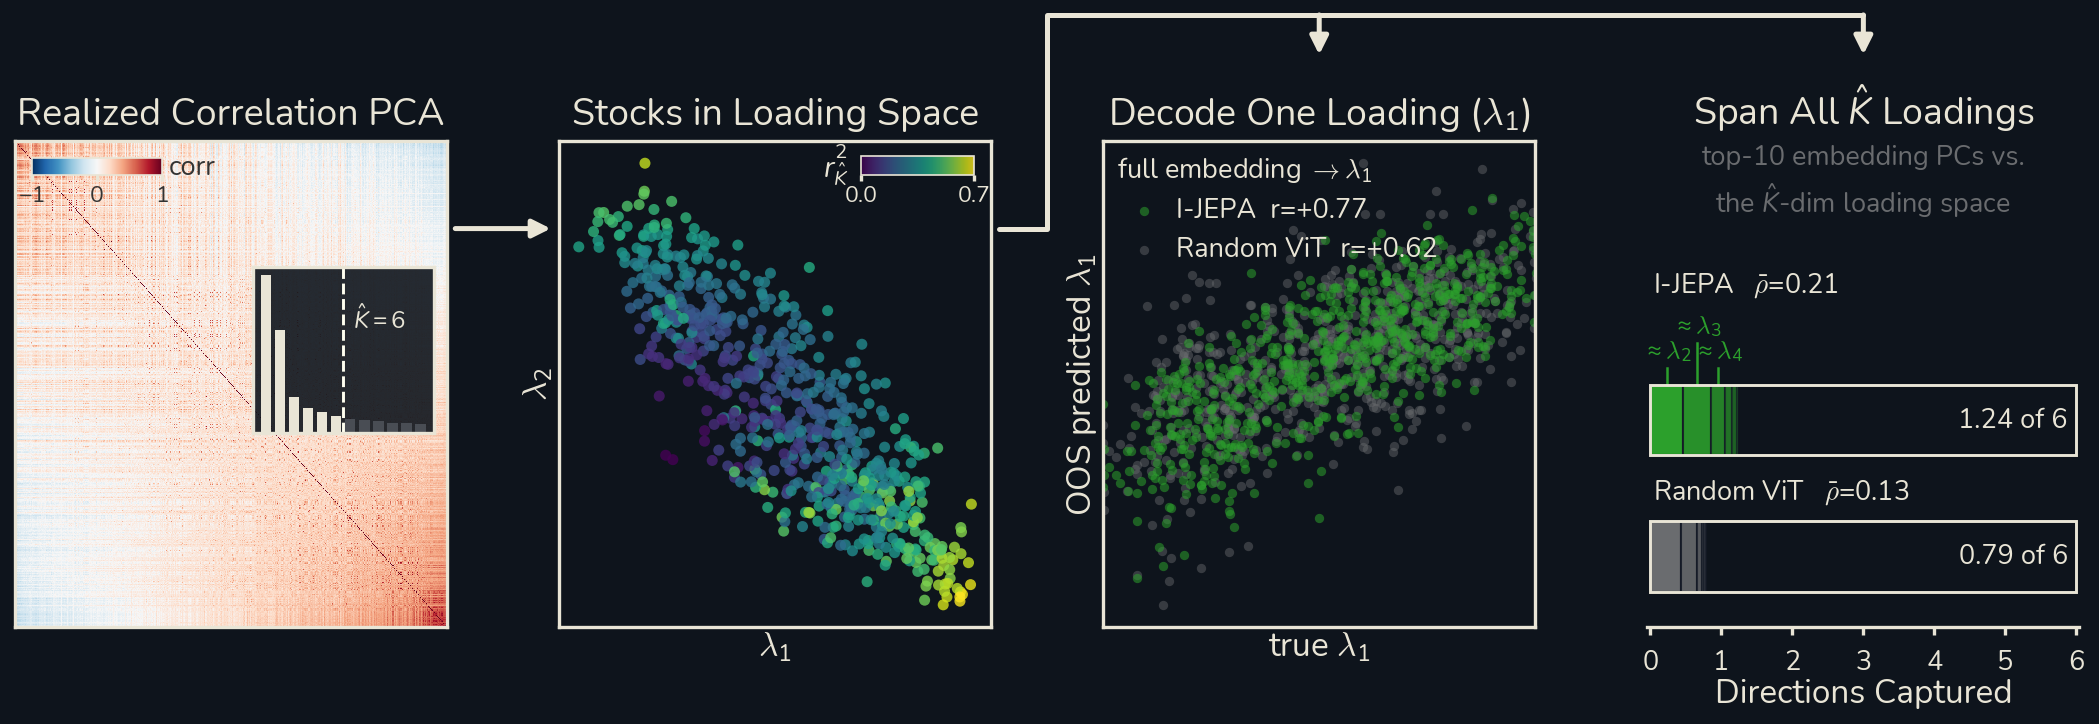
| Encoder | Decoded Loadings | Subspace Alignment |
|---|---|---|
| Supervised | ||
| Return | 0.633 | 0.202 |
| Vol | 0.581 | 0.207 |
| Spread | 0.459 (below floor) | 0.161 |
| Multihead | 0.582 | 0.243 |
| LeJEPA | ||
| Same Stock, Diff. View | 0.391 (below floor) | 0.199 |
| Time Warping | 0.518 | 0.218 |
| Gaussian Noising | 0.381 (below floor) | 0.162 |
| Cross Stock | 0.415 (below floor) | 0.167 |
| C-S, Same Industry | 0.433 (below floor) | 0.173 |
| SSL | ||
| DINO | 0.544 | 0.190 |
| BYOL | 0.444 (below floor) | 0.199 |
| CPC | 0.475 (below floor) | 0.166 |
| I-JEPA | 0.608 | 0.203 |
| MAE | 0.547 | 0.178 |
| TS2Vec | 0.464 (below floor) | 0.245 |
| CoST | 0.711 | 0.181 |
| TF-C | 0.534 | 0.221 |
| TimeMAE | 0.646 | 0.207 |
| Frozen time-series foundation models | ||
| Chronos-2 | 0.674 | 0.221 |
| Kronos | 0.620 | 0.184 |
| TimesFM 3.0 | 0.716 | 0.194 |
| Untrained floor | ||
| Random ViT | 0.495 | 0.151 |
Summary
How well an encoder forecasts says little about how it organizes the market. Methods that cluster by firm do not cluster by day, and the forecasting and organization rankings are unrelated.
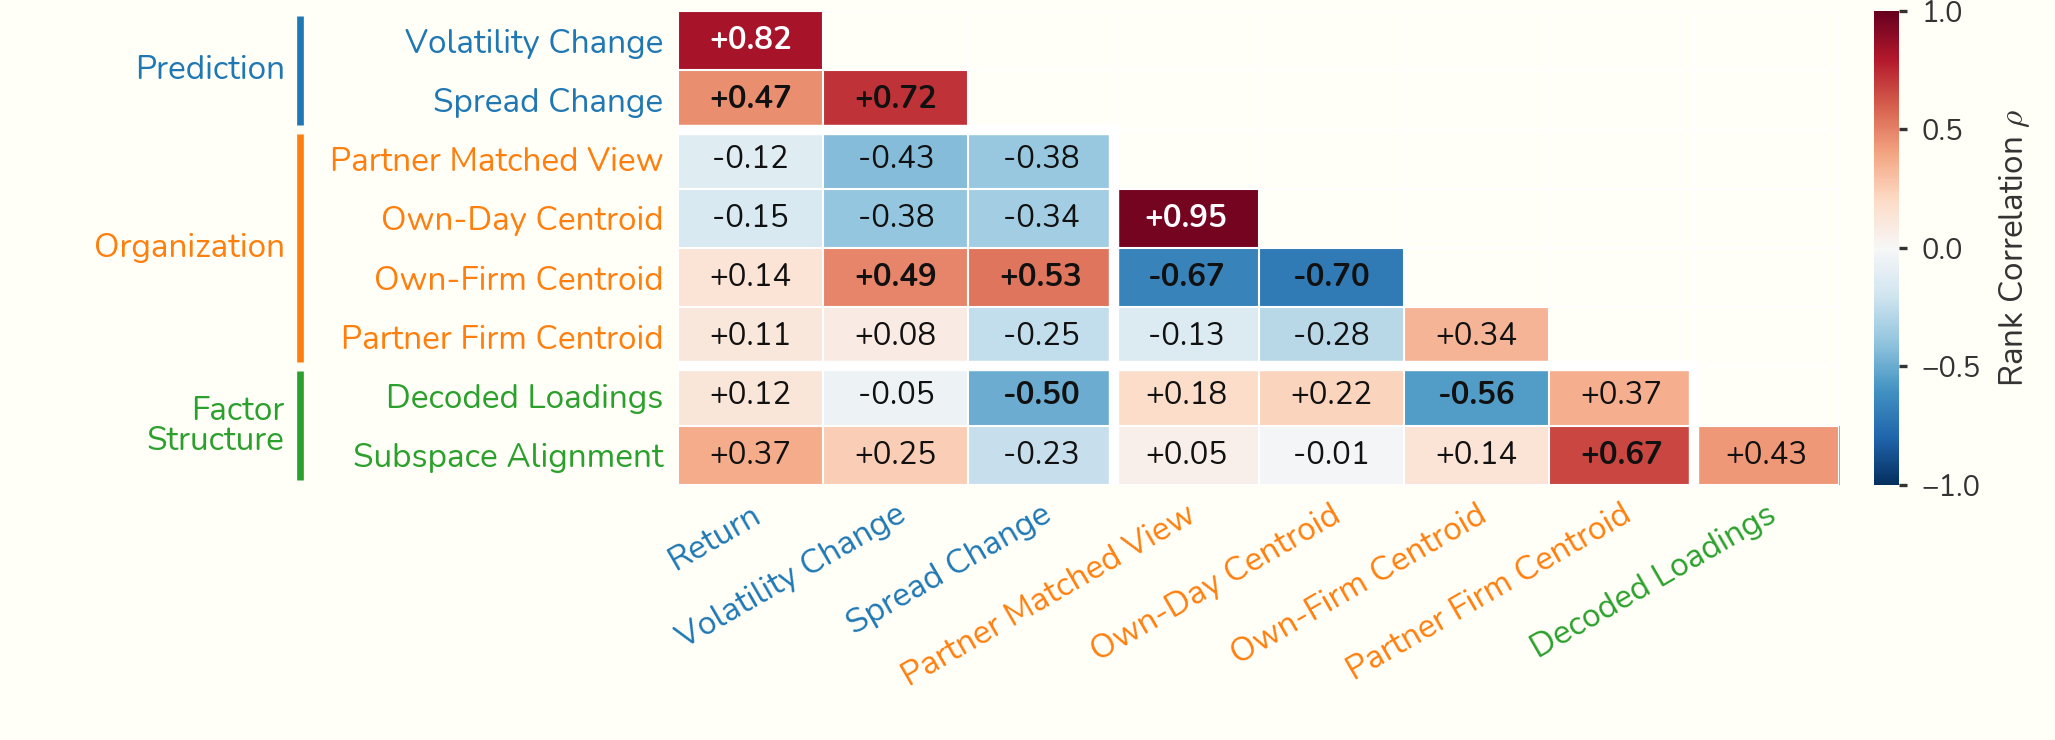
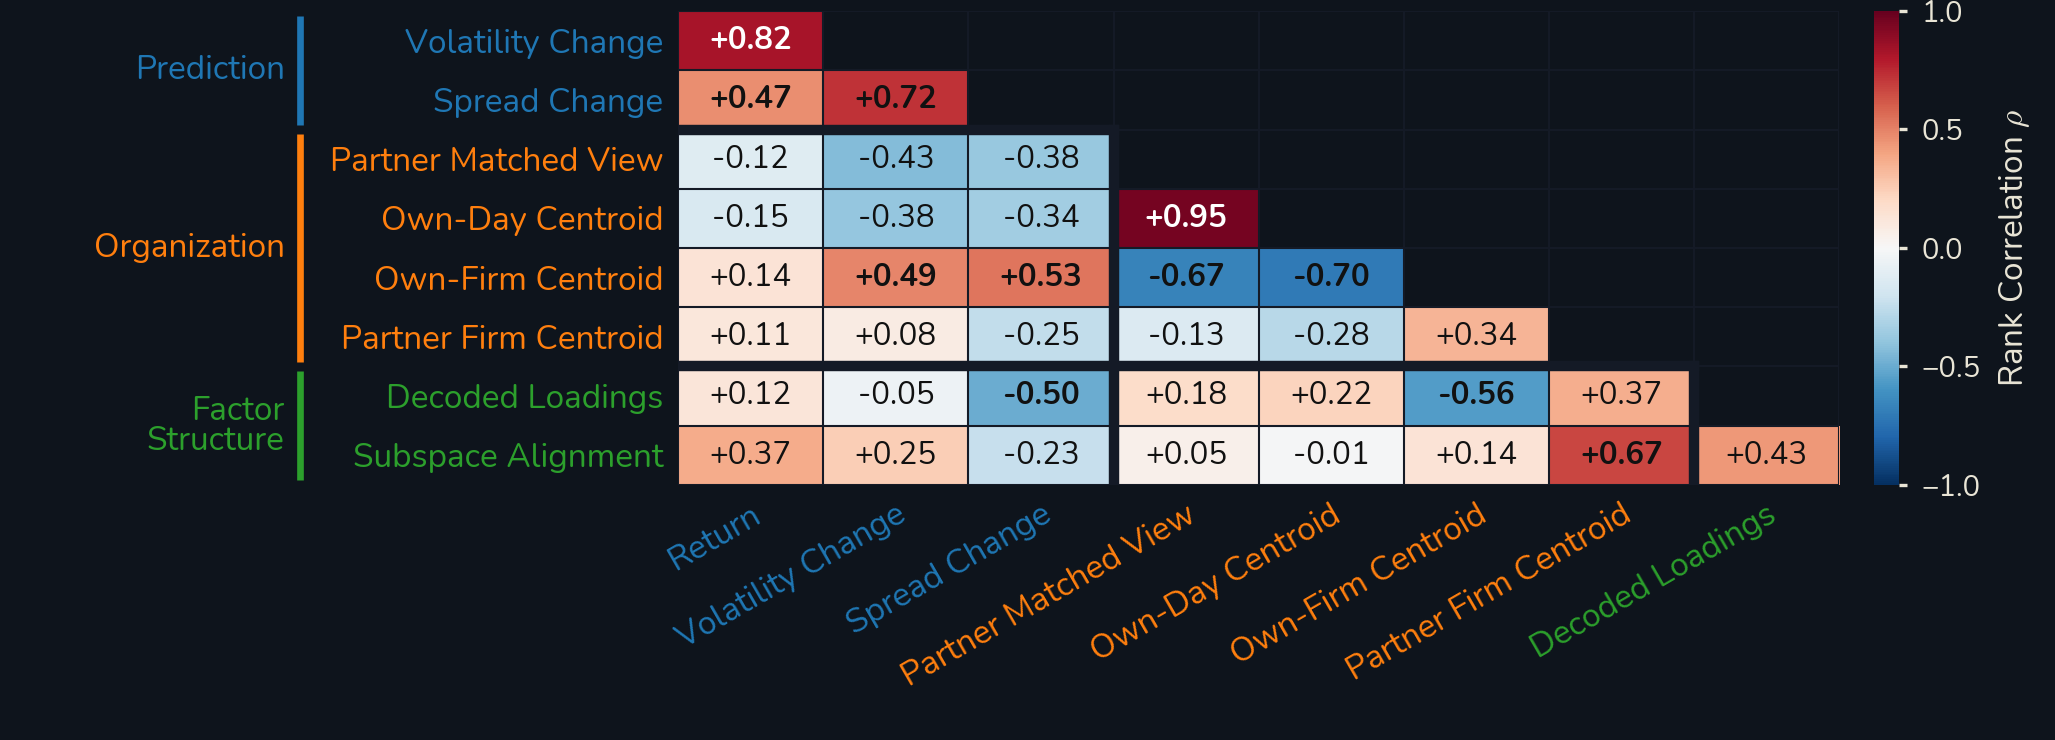
Spearman correlation between the 19 encoders' rankings on every pair of tasks; bold is p < 0.05. Own-day and own-firm clustering pull in opposite directions.
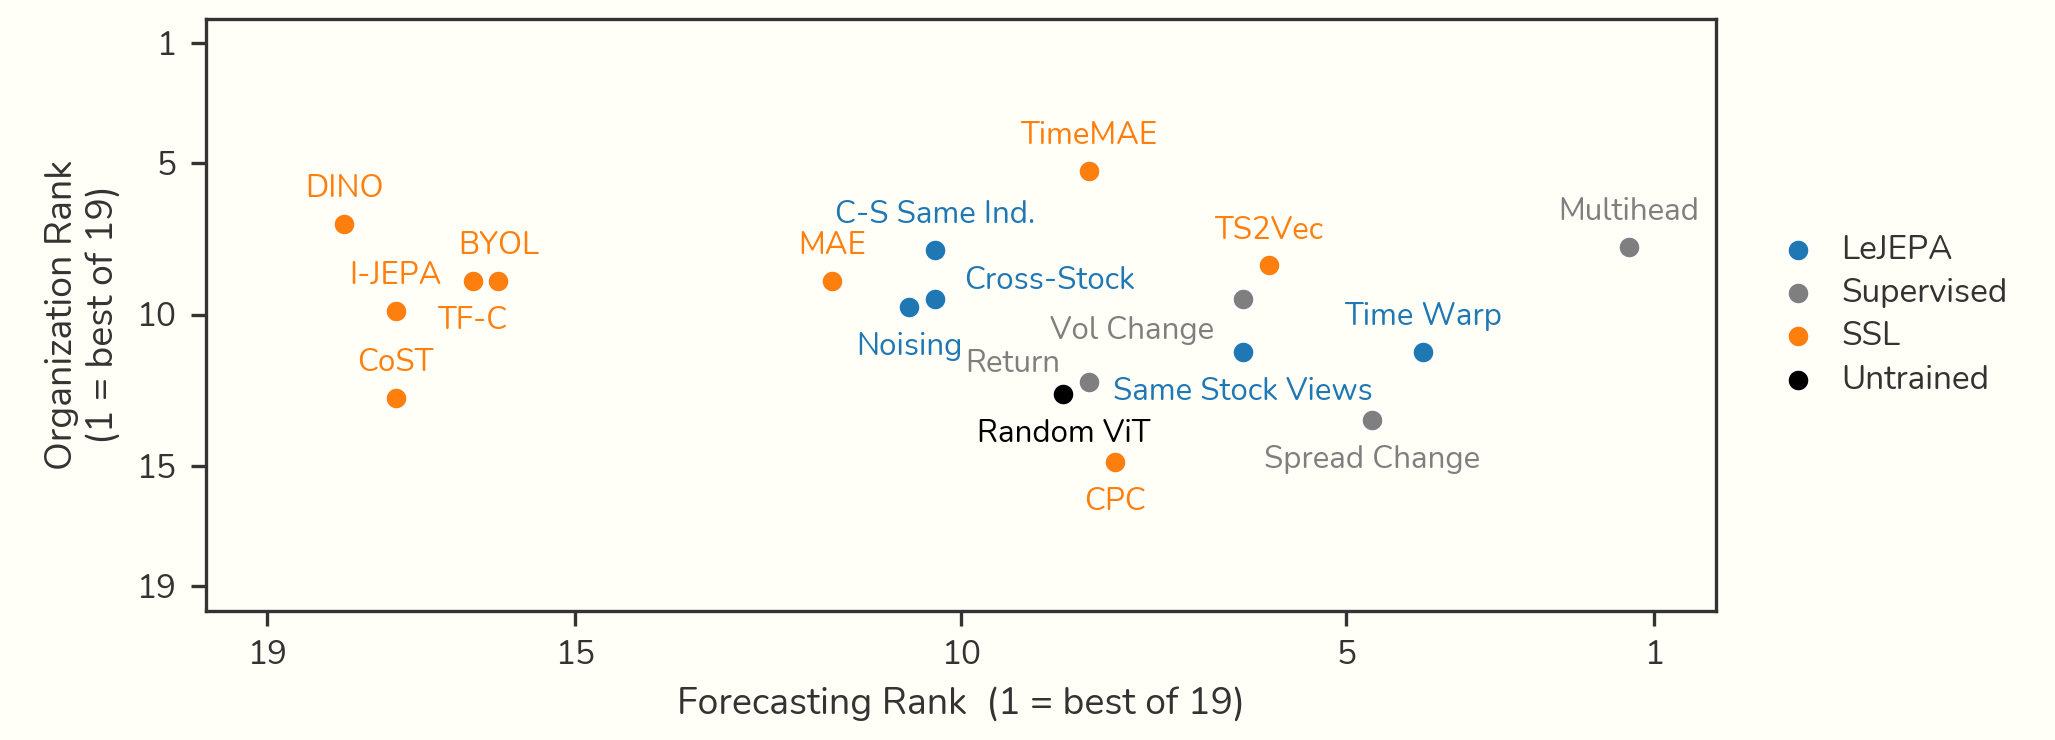
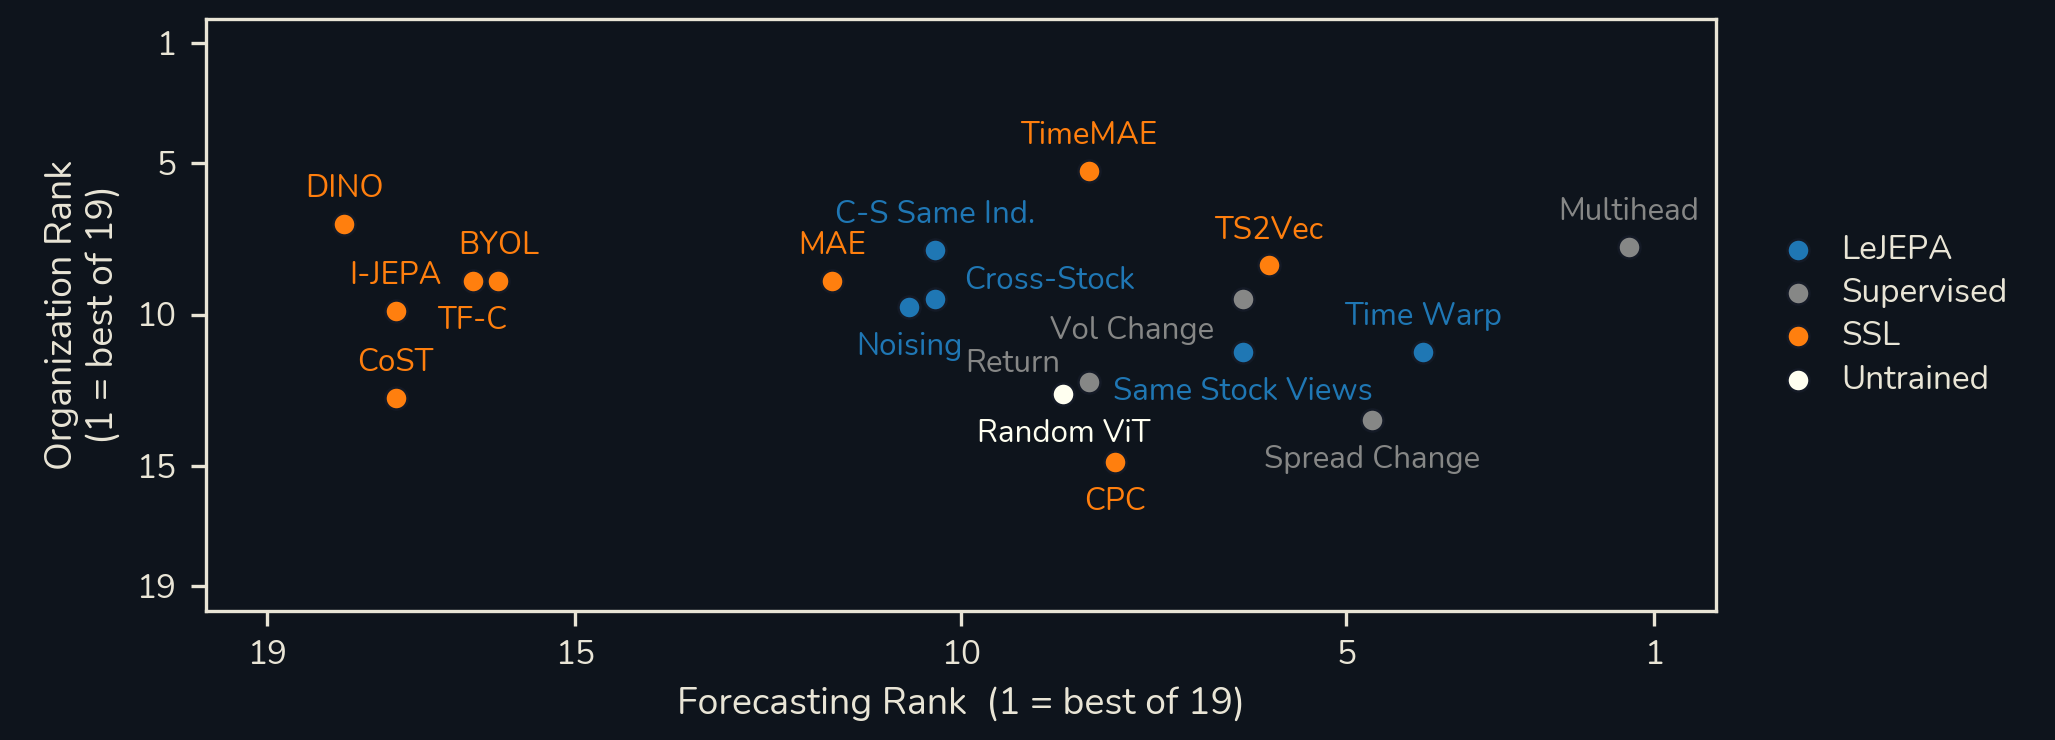
Each encoder's mean rank on forecasting against its mean rank on organization. TimeMAE and the supervised multihead trace the frontier.
Citation
Correspondence: bll@uchicago.edu
\cite{merchant2026towards}@inproceedings{merchant2026towards,
title={Towards Financial World Modeling},
author={Merchant, Humzah and Guthrie, Alec and Mahns, Simon and Balestriero, Randall and Levy, Bradford},
booktitle={The Fortieth Annual Conference on Neural Information Processing Systems},
year={2026},
url={https://arxiv.org/abs/2610.09048}
}References
- Gaoyue Zhou and Hengkai Pan and Yann LeCun and Lerrel Pinto. DINO-WM: World Models on Pre-trained Visual Features enable Zero-shot Planning. Forty-second International Conference on Machine Learning, 2025.
- Mido Assran and Adrien Bardes and David Fan and Quentin Garrido and others. V-JEPA 2: Self-Supervised Video Models Enable Understanding, Prediction and Planning. arXiv:2506.09985, 2025.
- Lucas Maes and Quentin Le Lidec and Damien Scieur and Yann LeCun and Randall Balestriero. LeWorldModel: Stable End-to-End Joint-Embedding Predictive Architecture from Pixels. 2026.
- Shengding Hu and Yuge Tu and Xu Han and others. MiniCPM: Unveiling the Potential of Small Language Models with Scalable Training Strategies. arXiv:2404.06395, 2024.
- Markus Pelger. Large-Dimensional Factor Modeling Based on High-Frequency Observations. SSRN, 2018.